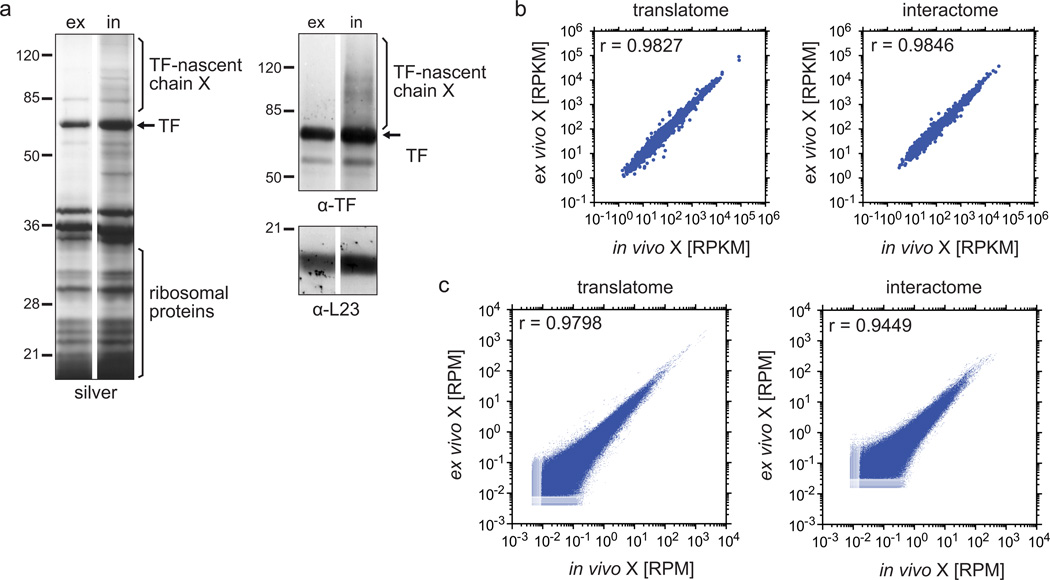
Figure 5.
Comparison of samples crosslinked in vivo and ex vivo in translatome and interactome analyses. (a) Gel analysis of the TF–RNC purification after ex vivo and in vivo crosslinking. For ex vivo crosslinking, E. coli MC4100 ∆tig::Kan + pTrc-tig-TEV-Avi cells grown in LB medium were harvested as described in step 1, option A, and the lysate was crosslinked ex vivo with DSP (step 7, option B). In vivo crosslinking was performed on cells grown in M9 minimal medium (step 1, option B and step 7, option A). After affinity purification and TEV elution, samples were treated with reducing sample buffer before being loaded onto an SDS-PAGE for silver stain and western blots using antibodies against TF and L23. Pictures from ex vivo and in vivo crosslinking were derived from the same gels and blots, but samples in between were cut out for this illustration. Crosslinks are abbreviated with ‘X’. (b,c) Scatter plots of gene expression levels and read densities comparing ex vivo and in vivo crosslinking. E. coli MC4100 ∆tig::Kan + pTrc-tig-TEV-Avi were grown in M9 minimal medium and treated as described in the protocol, including step 1, option B and step 7, option A for in vivo crosslinking, and step 1, option A and step 7, option B for ex vivo crosslinking. Ribosomes were isolated through a sucrose cushion centrifugation (step 18, option A) or sucrose gradient centrifugation (step 18, option B) for interactome and translatome, respectively. All downstream steps were done as described in the protocol and in the legend of Fig. 2, including the calculation of gene expression levels (b) and read densities in protein coding regions (c). Crosslinks are abbreviated with ‘X’.

