Figure 8.
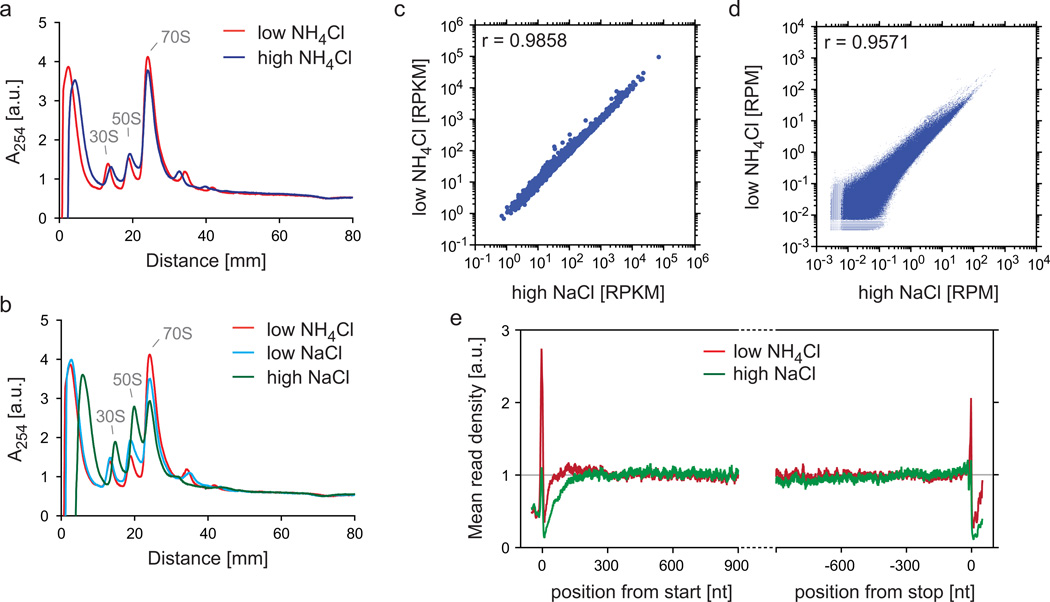
Impact of salt concentrations on the stability of ribosomes during ribosome purification. (a,b) Comparison of polysome profiles using different salt conditions. E. coli MC4100 cells grown in LB medium were harvested via the rapid harvest protocol (step 1, option C). The lysate was thawed according to step 7, option A and digested with MNase at a concentration of 15 U/A260, as described in the legend of Fig. 4a,b. Digested lysate was loaded onto sucrose gradients (step 18, option B) with different salts or salt concentrations: 100 mM NH4Cl (‘low NH4Cl’), 1 M NH4Cl (‘high NH4Cl’), 100 mM NaCl (‘low NaCl’), and 1 M NaCl (‘high NaCl’). ‘30S’ and ‘50S’ depict the peaks of the small and large ribosomal subunits, respectively. The monosome peak is labeled with ‘70S’. Polysome profiles were normalized to the area under the curves as explained in the legend of Fig. 4a,b. (c–e) Comparison of translatomes prepared under different salt conditions. Lysates were prepared and digested as in (a,b). Digested lysates were loaded onto sucrose cushions containing either 1 M NaCl (‘high NaCl’) or 100 mM NH4Cl (‘low NH4Cl’). Sequencing libraries (without rRNA depletion) were prepared and data were analyzed as described in the protocol. Gene expression levels (c), read densities in protein coding regions (d), and meta-gene analyses (e) were performed as described in in the legends to Fig. 2a, 2c, and 3a, respectively.

