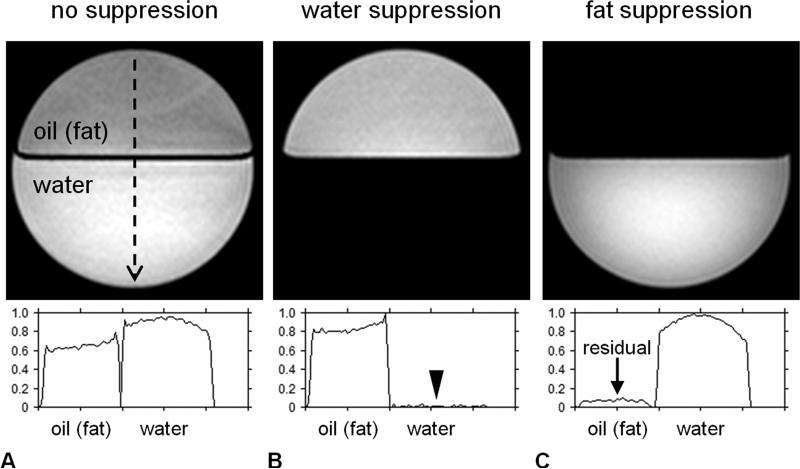
Figure 5.
Demonstration of frequency-selective MRI in a bilayer water-oil phantom (A) with no RF suppression, (B) with RF suppression spectrally targeted on the water resonance, and (C) with RF suppression spectrally targeted on the methylene resonance of fat. All three images were acquired with otherwise same imaging parameters and system settings and are illustrated using the same grayscale window/level display. A vertical signal profile line is plotted from top to bottom along each image (black dashed line) and shown in the accompanying plots. In (B), water suppression has effectively saturated all water signals (black arrowhead). In (C), residual fat signals (arrow) remain in the oil compartment. This is because the oil contains unsaturated TG (e.g. olefinic protons, vinyl groups) and only proton signals from the methylene peak of fat have been selectively suppressed. Image ratios of (A-C) can yield methylene fat-signal fraction and water-signal fraction maps.

