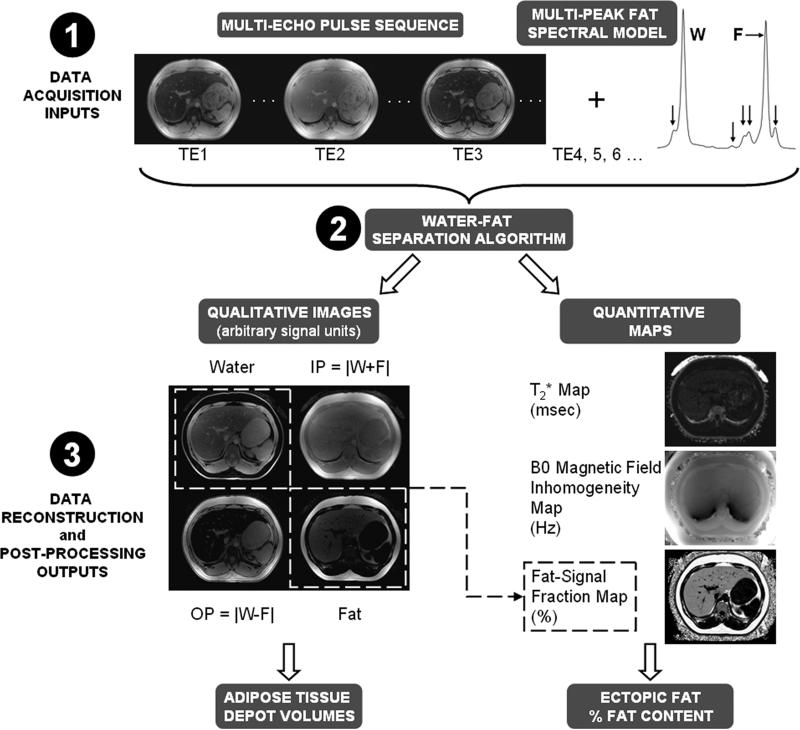
Figure 9.
A general schematic of multi-echo WFI. (Step 1) Data acquisition occurs at several echo times. (Step 2) Utilizing a multi-peak spectral model for fat (horizontal arrow: major methylene peak; vertical arrows: additional minor resonances), a reconstruction algorithm, often iterative, yields a set of co-registered grayscale water, fat, in-phase (IP), and out-of-phase (OP) volumes. (Step 3) In parallel, co-registered quantitative maps for T2* relaxation, B0 magnetic field inhomogeneity, and fat-signal fraction are generated. When noise and relaxometry effects are accounted for, the fat-signal fraction closely approximates the true underlying proton-density fat fraction. The seven outputs provide avenues for computing adipose tissue depot volumes and percent fat content in ectopic sites.

