
Fig. 5.
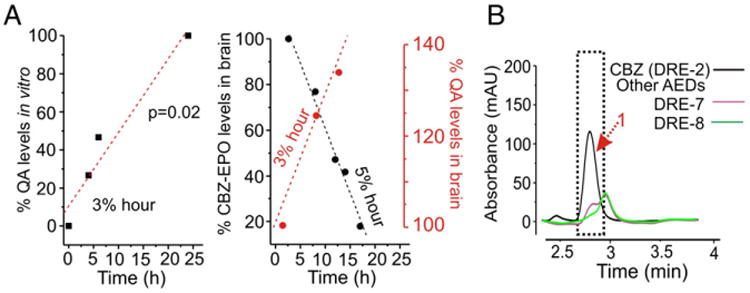
Time course of QA production. (A) Note that the axes in this panel refer to both CBZ-EPO (black ink) and QA (red ink). Ex vivo data: time-dependent disappearance of CBZ-epoxide (a known CBZ metabolite, black symbols) and appearance of QA (in red) occur at comparable rates. In vitro, brain EC produces QA at a rate of 3% per hour again similar to ex vivo; the figure depicts values obtained by MS-AMS analysis of 14C labeled CBZ and its products (see also Fig. 2C). (B) No QA was detected in samples from patients administered with AEDs other than CBZ.