
Figure 3. Tropisetron binds directly to APP.
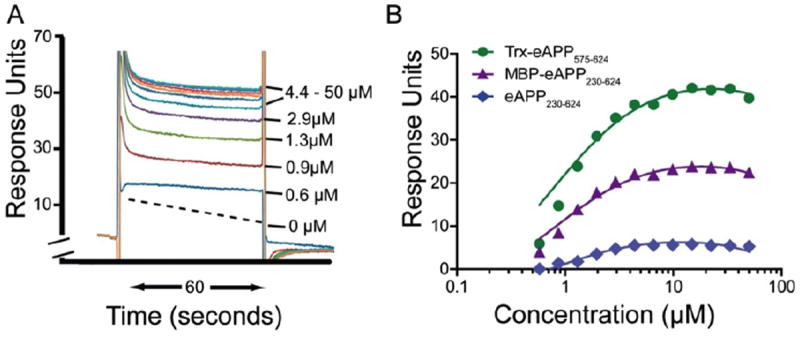
Surface plasmon resonance data was obtained as described in Methods. The sensograms obtained by flowing varying concentrations of tropisetron (0-50 μM) through the Trx-eAPP575-624 flow cell and before subtraction of the no-drug control is shown in A. The binding isotherms for tropisetron to various fragments of the ectodomain of APP695 are shown in B. The binding isotherms for tropisetron were fitted using a single binding site model. All three curves were constrained to share the same equilibrium constant with PRISM (GraphPad Inc). The resulting binding equilibrium constant was calculated to be 0.9μM ± 0.1μM with R2=0.99.