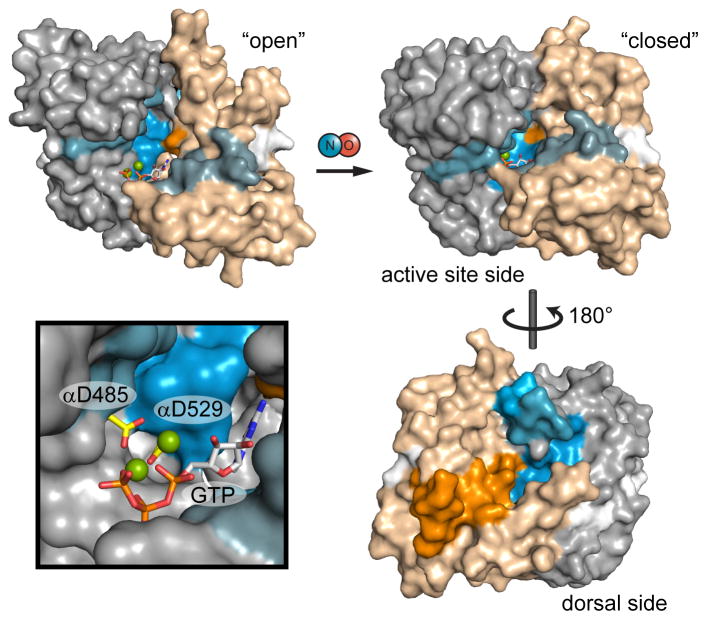
Figure 5. Mapping NO-induced conformational changes to models of catalytic domain activation.
Catalytic domain exchange rate differences induced by NO were mapped to models of the inactive, “open” conformation and active “closed” conformation. Exchange rate differences are color-coded as in Figure 3; here, α1 and β1 subunits are distinguished as gray and tan, respectively. The open conformation is represented by the structure of the human sGC catalytic domain (PDB: 3UVJ) with GTP docked. The closed conformation is a model based on the structure of a putatively active adenylate cyclase (PDB: 1AZS). Active site aspartate residues, α1 Asp-485 and α1 Asp-529, are highlighted (yellow) in the inset.

