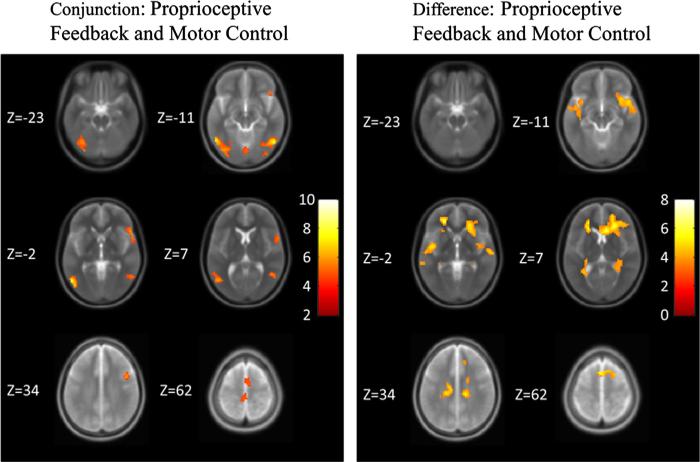
Fig. 3.
SPMs projected onto a normalized averaged structural (T2-weighted) image across six slices at significance p<0.05, AlphaSim corrected. Z values of the slices are given. The color bar shows the t-statistic (T-score). (Left) Areas that were activated during both the ankle DF/PF task vs. visual stimulation control task and the active balance simulation task vs. the visual stimulation control task. (Right) Areas that were activated during the active balance simulation task more greatly than the ankle DF/PF task.

