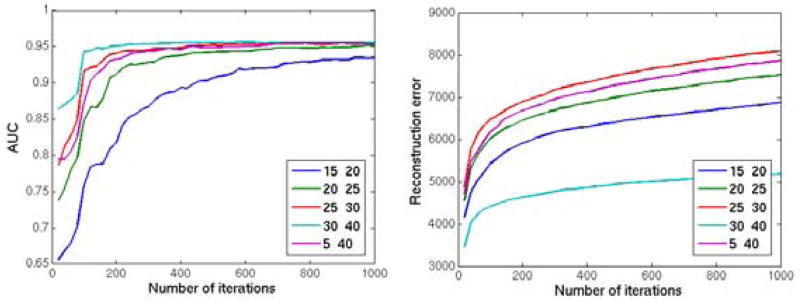
Figure 10.

Reconstruction of the 2 dimensional image with simulated abnormalities using different parameter values of the patch size range (si ∈ {[15, 20], [20, 25], [25, 30], [30, 40], [5, 40]}. Left: The AUC value for the agreement between the ground truth abnormality mask and the abnormality map computed by the method; Right: The l2 norm of the voxelwise difference between the reconstructed image and the original image. The method is applied for 1000 iterations and the results are calculated in every 20 iterations.
