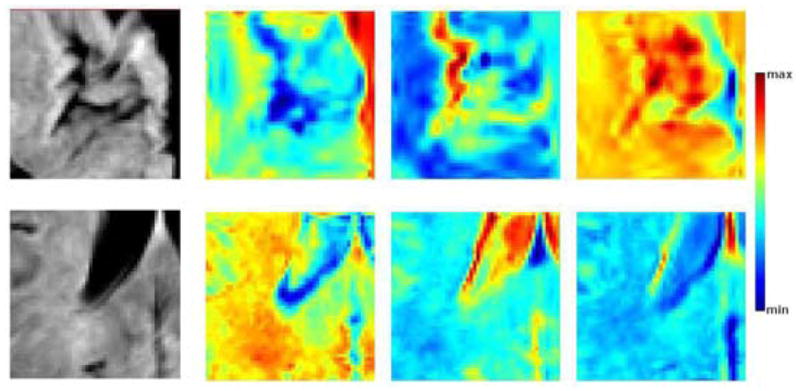
Figure 6.

First three eigenvectors for cortical (top) and periventricular (bottom) patches. Leftmost, sample image patch from the training set; from left to right, the most significant eigenvectors in order of significance. The eigenvectors for the cortical patches explain 32.5, 7.5 and 5.9 % of the total variation, those for the periventricular patches explain 34.9, 11.2 and 6.3 % of the total variation. The colormap is stretched to the min. and max. values of each eigenvector for visualization purposes.
