Figure 8.

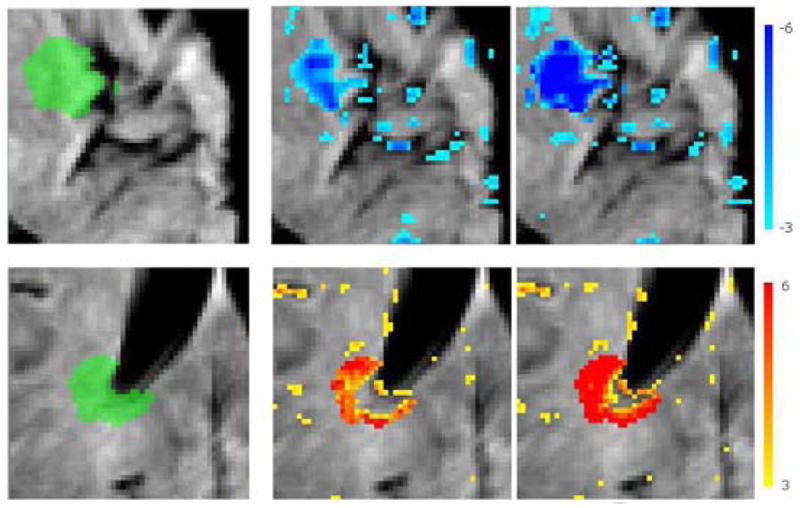
Thresholded abnormality maps for simulated abnormalities on cortical (top) and periventricular (bottom) patches. Left: Ground-truth mask, middle: abnormality map for intensity offset values ±20, right: and ±40

Thresholded abnormality maps for simulated abnormalities on cortical (top) and periventricular (bottom) patches. Left: Ground-truth mask, middle: abnormality map for intensity offset values ±20, right: and ±40