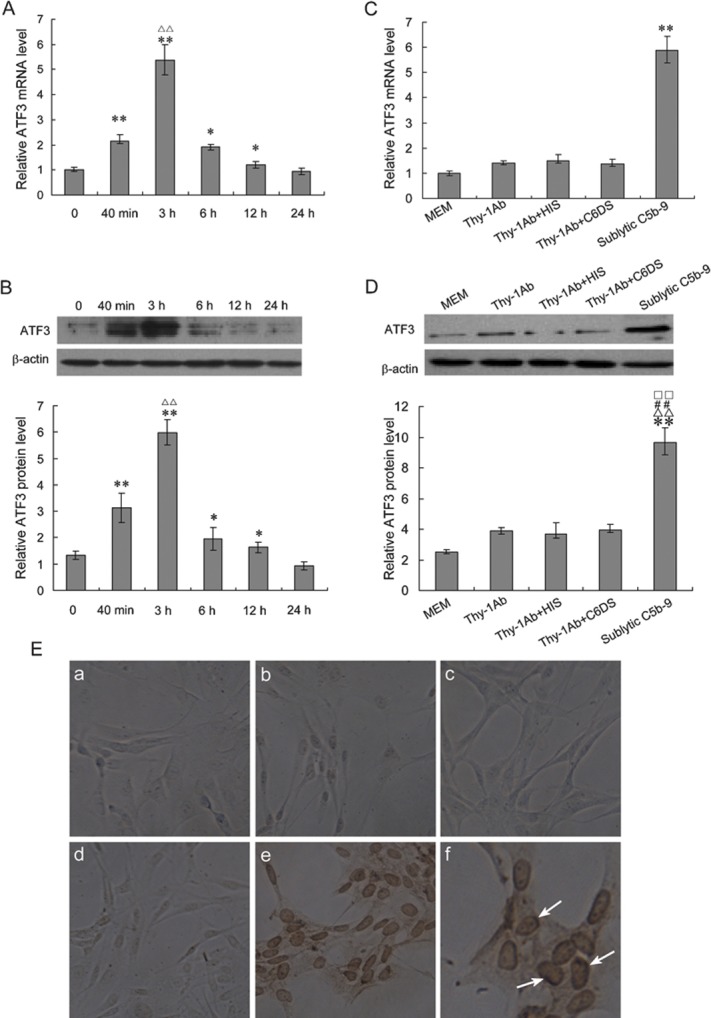
Figure 1.

Expression pattern of rat ATF3 mRNA and protein. (a, b) The cultured rat GMCs were treated with sublytic C5b-9 for the indicated time points and analyzed by real-time PCR for ATF3 mRNA (a) or by western blot for ATF3 protein (b). The results showed that the levels of ATF3 mRNA and protein increased at 40 min after sublytic C5b-9 attack, peaked at 3 h, and then gradually reduced at 6 and 12 h (*P<0.05, **P<0.01 vs 0 h, ΔΔP<0.01 vs 40 min). (c, d) The cultured rat GMCs were treated with MEM, Thy-1 Ab, Thy-1 Ab+HIS, Thy-1 Ab+C6DS or sublytic C5b-9 for 3 h. Expression of ATF3 (mRNA and protein) was analyzed by real-time PCR (c) and western blot (d). β-actin was used as the loading control. All data represent averages and mean±SD from three independent experiments. The data showed that ATF3 expression increased at 3 h after exposure to sublytic C5b-9 compared with other control groups (**P<0.01 vs MEM, ΔΔP<0.01 vs Thy-1Ab, □□P<0.01 vs Thy-1 Ab+HIS, and # #P<0.01 vs Thy-1 Ab+C6DS). (e) Rat GMCs were cultured on plastic slides and treated with MEM (i), Thy-1 Ab (ii), Thy-1 Ab+HIS (iii), Thy-1 Ab+C6DS (iv) or sublytic C5b-9 (v) for 3 h then detected by immunohistochemistry using anti-ATF3 antibody and visualized under a microscope ((i)–(v), ×200; (vi), ×400; arrow, positive staining). The results showed that ATF3 protein in the sublytic C5b-9-treated group was markedly increased at 3 h and distributed largely in the nuclei of GMCs, while other control groups did not show a positive reaction of ATF3 staining. The images are representative of three independent experiments. Ab, antibody; ATF3, activating transcription factor 3; GMC, glomerular mesangial cell; HIS, heat-inactivated serum; MEM, modified Eagle's medium; PCR, polymerase chain reaction.
