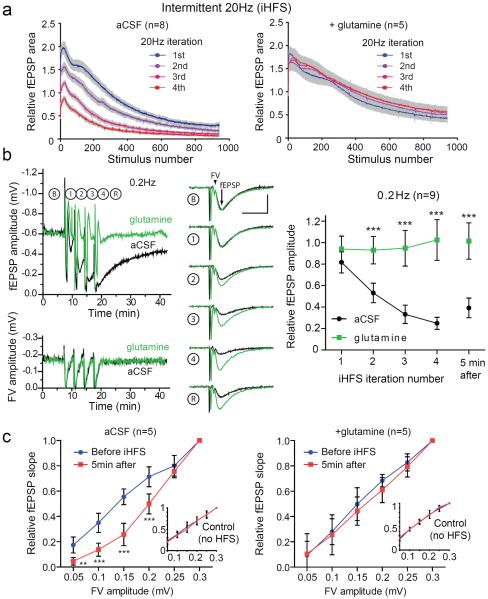
Figure 2. iHFS causes use-dependent fEPSP depression that is prevented by glutamine.
(a) Evoked fEPSP amplitudes during intermittent 20 Hz stimulation with four iterations of 1000 pulses at 20 Hz separated by 200 sec of recovery at 0.2 Hz in aCSF (left panel; n=8) and aCSF with 500 μM glutamine (right panel; n=5). (b) Time course of fEPSP amplitude (upper left) and FV amplitude (lower left) during iHFS protocol on slices in aCSF (black) and aCSF with glutamine (green). Traces of evoked fEPSP during 0.2 Hz stimulation at baseline (B), after successive iterations of 1000 pulses at 20Hz (1–4), and after a subsequent 5 min recovery period (R) of 0.2Hz stimulation (middle panel) and summary (right panel; n=9, 2-way repeated measures ANOVA with Bonferroni post test, ***P<0.001, error bars represent 95% CI) demonstrate activity-dependent reduction in fEPSP amplitude. FV and fEPSP are indicated by the arrowhead and arrow respectively in baseline sample tracings in (b). Scale bars=10ms, 0.5mV. (c) Graphs of input (FV amplitude in mV) and output (relative fEPSP slope) are plotted for stimulated (iHFS) electrodes with control stimulation pathway (continuous 0.2 Hz stimulation) shown in insets. I/O curves before iHFS (blue) and after (red) in the absence (left) and presence (right) of glutamine (2-way repeated measures ANOVA with Bonferroni post test, **p<0.01, ***P<0.001, error bars represent 95% CI). The same recording electrode was used for iHFS and control stimulating electrodes.

