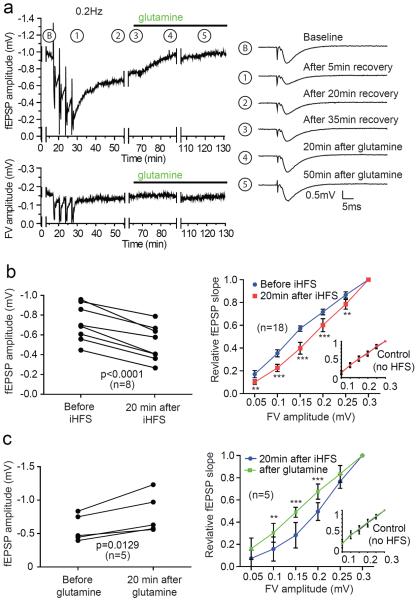
Figure 3. Glutamine reverses iHFS induced fEPSP amplitude reduction.
(a) Time course of fEPSP amplitude (upper trace) and FV (lower trace) with standard iHFS protocol followed by addition of glutamine. Traces during collection of data for I/O relationship were removed (and depicted by gaps) for clarity. Example traces during 0.2 Hz stimulation at indicated time points are depicted on right. (b) Paired plot of fEPSP amplitude measurement before and after iHFS protocol (left panel) shows significant depression at 20 min after the iHFS (student's t-test, p<0.0001) and a corresponding rightward shift in the I/O curve (right panel). There is no change in the I/O curve for the control pathway (inset). (c) Addition of glutamine 20 min after iHFS protocol significantly increases fEPSP amplitude 20 min later (left panel; student's t-test, p=0.0129). There is also a corresponding leftward shift of the I/O curve (right panel). Note glutamine does not affect the I/O curve of the control pathway (inset). For statistical analyses of the I/O curves 2-way repeated measures ANOVA with Bonferroni post test was applied (**p<0.01, ***p<0.001).

