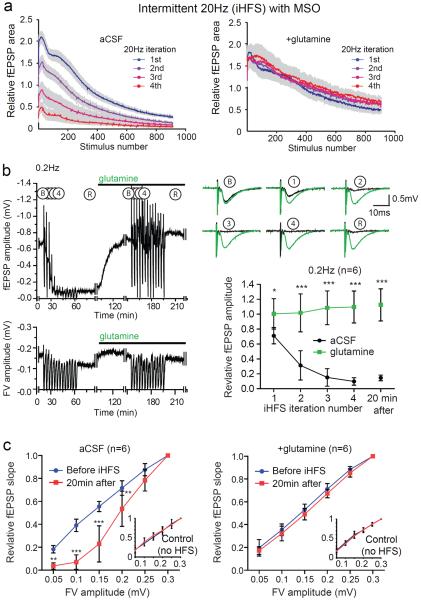
Figure 4. Inhibiting glutamine synthesis with MSO enhances iHFS induced fEPSP depression.
(a) Evoked fEPSP amplitudes for MSO treated slices during four iterations of 1000 pulses at 20 Hz separated by 200 sec of recovery at 0.2 Hz in aCSF (left panel; n=8) and aCSF with 500 μM glutamine (right panel; n=5). (b) Representative time course of evoked fEPSPs (upper) and fiber volleys (lower) in MSO treated slice. Note that adding glutamine after iHFS was associated with recovery that persisted during an additional 13 HFS iterations. Gaps represent time periods during which data for the I/O relationship were being collected. Traces of evoked fEPSP during 0.2 Hz stimulation at baseline (B), after successive iterations of 1000 pulses at 20 Hz (1–4), and after a subsequent 5 min recovery period (R) of 0.2 Hz stimulation (upper right panel) and summary (lower right panel; n=6, 2-way repeated measures ANOVA with Bonferroni post test, *p<0.05, ***p<0.001, error bars represent 95% CI) demonstrate the reduction in fEPSP in the MSO treated slices and the recovery with addition of glutamine. (c) I/O curves before iHFS (blue) and after (red) for MSO treated slices in the absence (left) and presence (right) of glutamine (2-way repeated measures ANOVA with Bonferroni post test, **p<0.01, ***p<0.001, error bars represent 95% CI). Insets: I/O curves for laterally displaced control electrodes that were stimulated continuously at 0.2 Hz.

