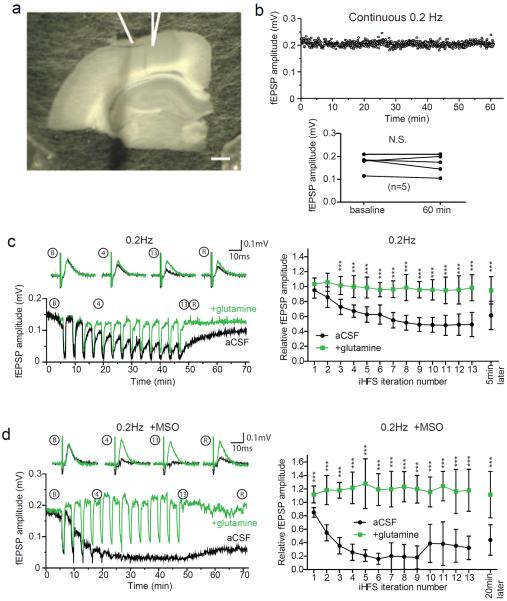
Figure 6. Glutamine prevents fEPSP depression during repetitive stimulation of Layer I cortical afferents.
(a) Bright field image of rat brain slice in which Layer I cortical axons have been transected and separated from on column deeper layers. Positions of stimulating (left) and recording electrode (right; in Layer III where Layer V apical dendrites project) are depicted by line drawings. (b) Representative time course of evoked fEPSP amplitude during continuous 0.2Hz stimulation protocol (upper) and plot of paired fEPSP amplitude measurements at 5 min and 60 min for 5 slices stimulated continuously at 0.2 Hz (lower; student's t-test, no significant difference). (c) Representative time course of evoked fEPSP amplitudes recorded during 0.2 Hz stimulation period during baseline (B), after 4th (4) and 13th (13) HFS iteration, and during recovery (R) with sample traces above (black trace, aCSF; green trace, glutamine). Summary of fEPSP amplitude after each HFS iteration (right panel; n=5, 2-way repeated measures ANOVA with Bonferroni post test, ***p<0.001, error bars represent 95% CI). (d) As in (c) with slices preincubated with glutamine synthetase inhibitor MSO.

