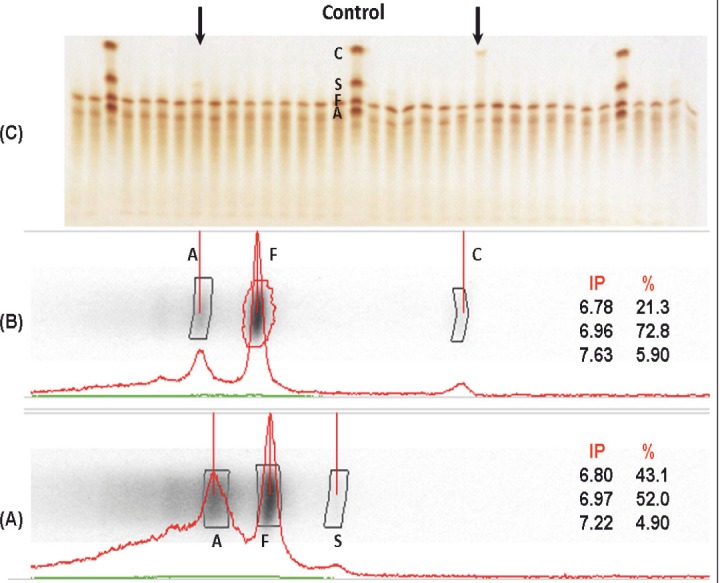
Figure 1. Densitometric analysis of two positive cases, one for Hb AS (A) and one for Hb AC (B). Samples run by isoelectric focusing electrophoresis (C) in agarose gel, using hemoglobin control AFSC.Arrows indicate positive cases. IP = isoelectric point, % = Percentage of hemoglobin type.

