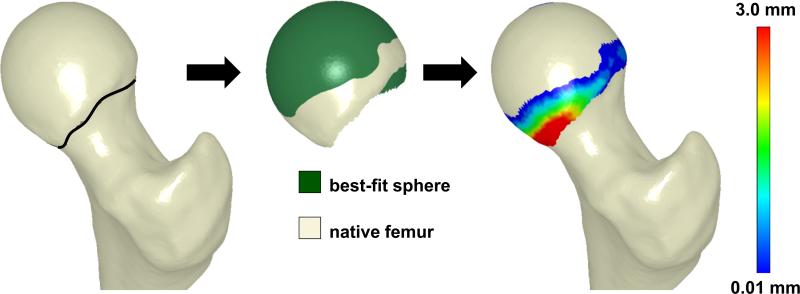
Figure 1.
Process of femoral head isolation and sphere fitting. Left - The femoral head was delineated from the neck using inflection points around the circumference of the head-neck junction (black line). Middle - The isolated head (off-white) was then projected onto the best fitting sphere surface (green). Right - Deviations (mm) between the femur and the best-fit sphere were calculated across the isolated surface of the head.

