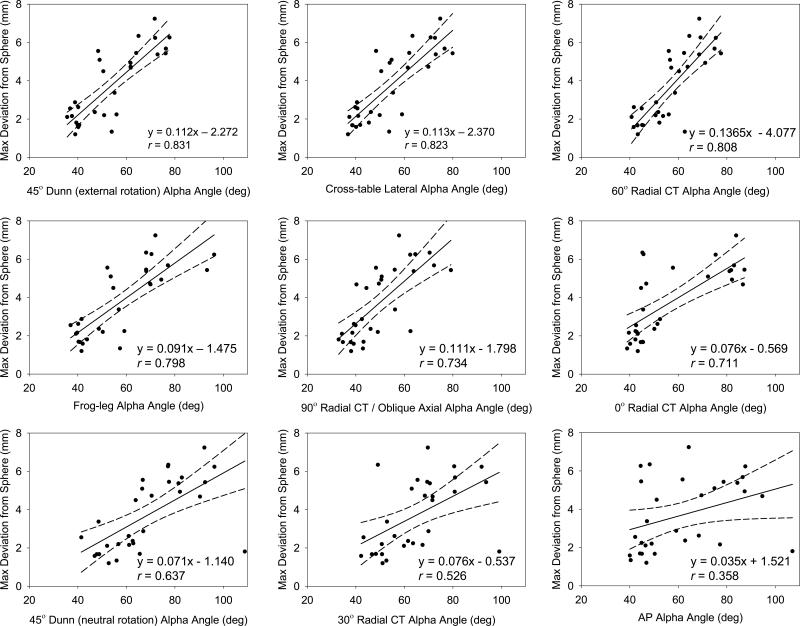
Figure 6.
Linear regressions (solid line), including 95% confidence intervals (dashed lines), of alpha angles compared to maximum deviations from spheres. Best-fit lines and correlation coefficients (r) are provided in each plot. Starting in the upper left panel and moving to the right, plots have been presented in order of decreasing r value strength.

