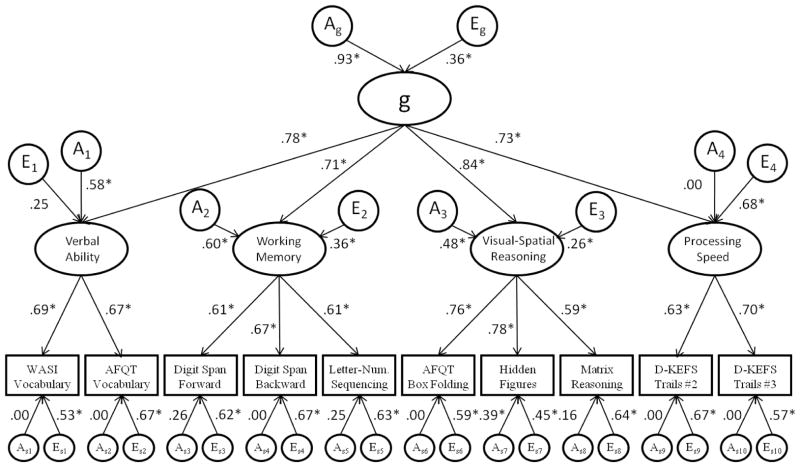
Figure 3. Best-fitting model of the combined genetic and unique environmental factor structures.
A = Additive genetic influences. E = Unique environmental influences. Common environmental influences (C), although not presented here, are estimated as a Cholesky structure. Parameters with a subscript “s” notation represent variable specific genetic and environmental influences. Values are presented as standardized parameter estimates. Parameter estimates with an asterisk (*) are significantly greater than zero based on 95% confidence intervals.

