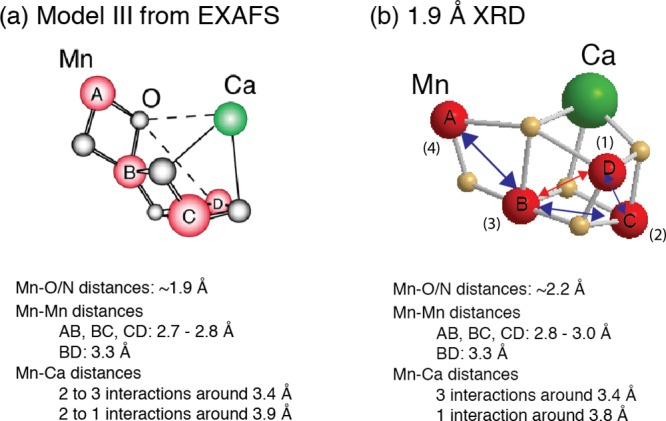
Figure 3.

Structural models for the Mn4CaO5 cluster from (a) the polarized EXAFS and Sr EXAFS studies and (b) the 1.9 Å resolution XRD study.21 The Mn–Mn and Mn–O/N ligand distances from each of these studies are summarized below the respective structural model. Mn atoms are depicted in red, and Ca atoms are depicted in green. The O atoms are in gray in (a) and in yellow in (b). Reproduced with permission from ref (70). Copyright 2013 American Society for Biochemistry and Molecular Biology.
