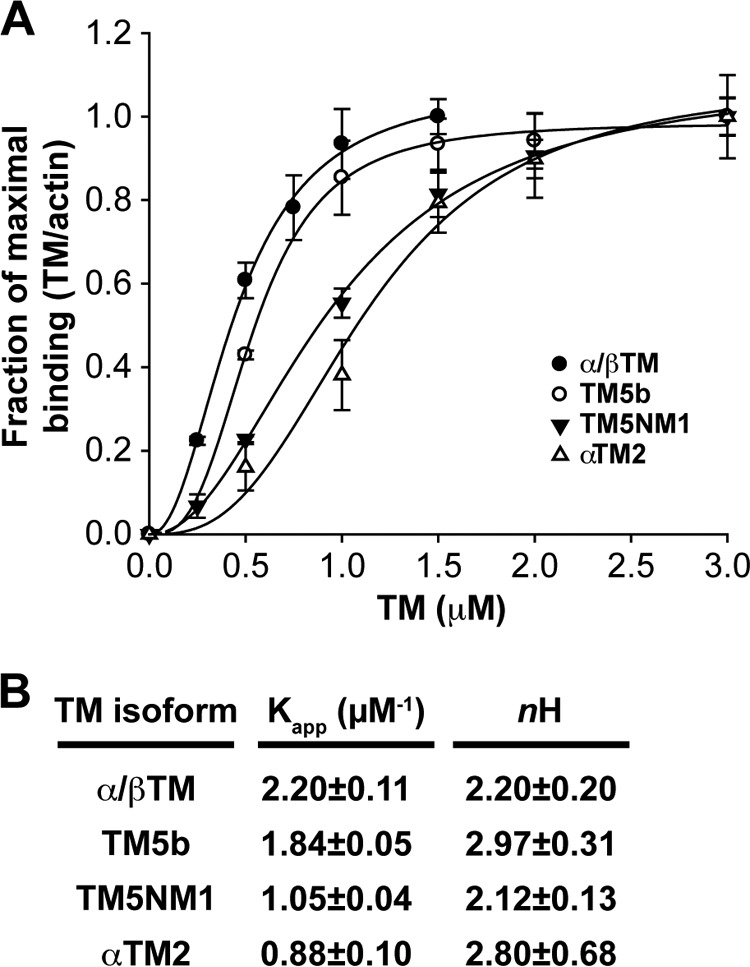
FIGURE 2.

Binding of α/βTM, TM5b, TM5NM1, and αTM2 to skeletal muscle αsk-actin filaments as determined in a co-sedimentation assay. A, purified TMs at the indicated concentrations were mixed with 4 μm prepolymerized F-actin, incubated 30 min at room temperature, and ultracentrifuged to sediment F-actin with bound TMs. Equivalent volumes of supernatants and pellets were analyzed by SDS-PAGE and Coomassie Blue staining followed by densitometry to quantify the percentage of TM in the supernatant or pellet. After subtraction of the amount of TM sedimenting in the absence of F-actin, the amount of TM in the pellet was converted to mol of TM/mol of actin and plotted as a percentage of maximal TM binding to better compare the binding curves for each TM (which saturate F-actin at somewhat different molar ratios due to their different lengths). Note that α/βTM concentrations >1.5 μm were not tested because saturation had been achieved. Curves are drawn based on fitting to the Hill equation for cooperative binding using SigmaPlot 9.0. Data shown are mean ± S.D. (error bars) of three experiments. B, tabulation of the Kapp and Hill coefficient (nH) of each TM.
