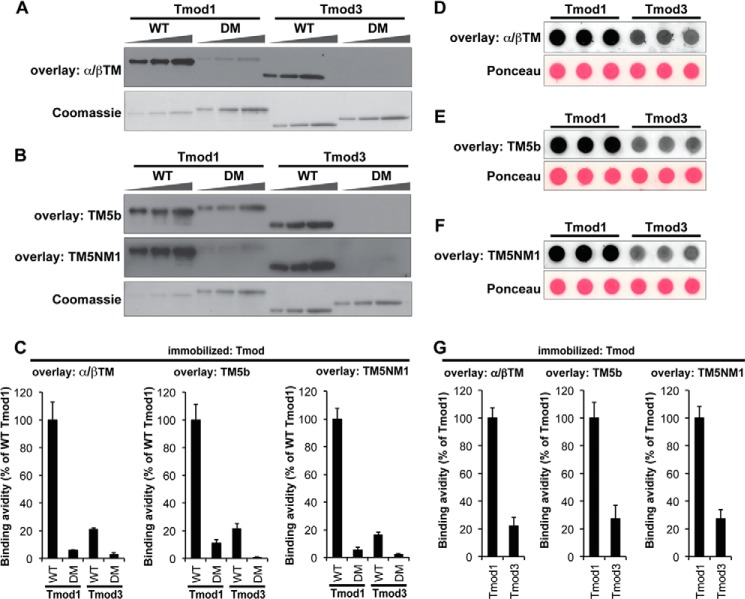
FIGURE 3.
Tmod1 binds more strongly than Tmod3 to α/βTM, TM5b, and TM5NM1. A and B, increasing amounts of Tmod proteins (WT Tmod1, Tmod1-L27G/I131D (double mutant (DM)), WT Tmod3, and Tmod3-L29G/L134D (double mutant (DM)); 100, 200, and 400 ng from the left) were separated by SDS-PAGE, transferred to nitrocellulose membranes, and overlaid with 5 μg/ml α/βTM (A), TM5b (B), or TM5NM1 (B). Bound TMs were detected using anti-TM antibodies. Parallel Coomassie-stained gels show Tmod loading amounts. Note that wild-type Tmod1 showed relatively strong TM-binding ability; thus, only one-fourth as much wild-type Tmod1 was loaded as compared with the other Tmod proteins (25, 50, and 100 ng from the left). C, relative TM-Tmod binding was quantified densitometrically by normalizing the band intensities from the overlays to their corresponding Coomassie-stained bands. Data shown are mean ± S.D. (error bars) of four lanes. D–F, wild-type Tmod1 or Tmod3 (200 ng each) diluted in 5 μg/ml BSA in a Hepes-buffered salt solution was spotted directly onto nitrocellulose membranes in the absence of detergents and overlaid with 5 μg/ml α/βTM (D), TM5b (E), or TM5NM1 (F). Bound TMs were detected using anti-TM antibodies. Ponceau S staining shows uniform loading amounts of Tmods and BSA. G, relative TM-Tmod binding was quantified densitometrically by normalizing the background-corrected dot intensities from the overlays to the background-corrected intensities of their corresponding Ponceau-stained dots. Data shown are mean ± S.D. (error bars) of three lanes.

