FIGURE 2.
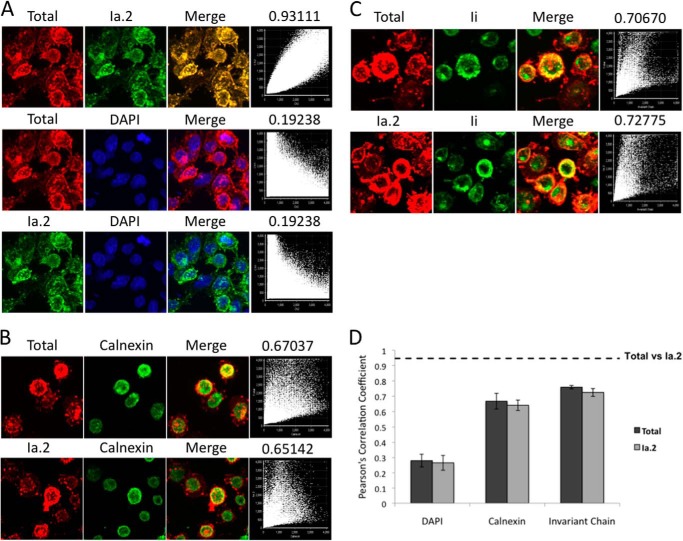
Subcellular localization of Ia. 2+ class II molecules. A, I-Ak-expressing K46μ B cells were attached to coverslips, fixed, permeabilized with saponin, and stained with 11-5.2-(anti-Ia.2)-Alexa Fluor 488, 10-3.6-(anti-I-Ak)-Alexa Fluor 594, and DAPI. Shown are z-stack confocal images. Dot plots show the correlation of DAPI, Alexa Fluor 488, and Alexa Fluor 594 signal. The Pearson's correlation coefficient shown above each dot plot indicates the extent of marker correlation (1.00 equals 100% correlation). B, I-Ak-expressing B cells were stained for the ER marker calnexin and either total or Ia.2+ class II and analyzed as in panel A. C, I-Ak-expressing B cells were stained for the class II chaperone Ii and either total or Ia.2+ class II and analyzed as in panel A. Panels A–C show representative results from 1 of 3 or more independent experiments. D, plot of the average Pearson's correlation coefficient for 10 individual cell z-stacks analyzed and averaged for a total of three separate coverslips (30 total cells/condition). The dotted line indicates the Correlation Coefficient of total versus Ia.2+ class II (panel A). The error bars indicate ± 1 S.D.

