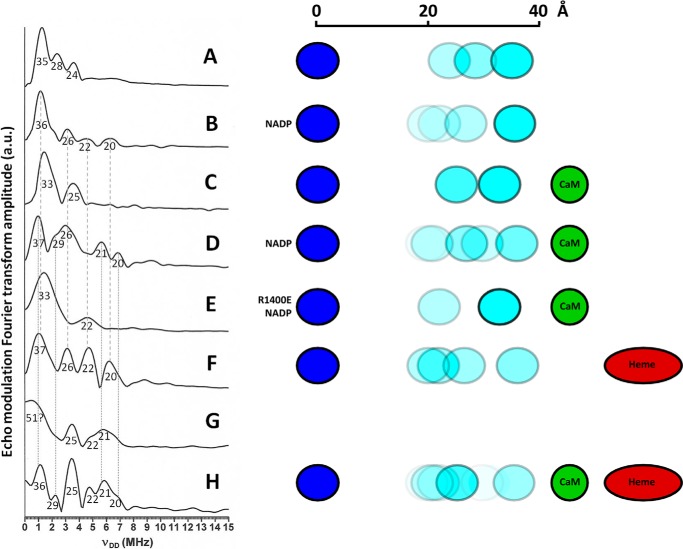
FIGURE 4.
Multiple nNOS conformations accessed by PELDOR spectroscopy. Fourier transforms of the refocused echo modulation obtained from four-pulse ELDOR experiments on: nNOSred (A), nNOSred + NADP+ (B), nNOSred + CaM (C), nNOSred + CaM + NADP+ (D), R1400E nNOSred + CaM + NADP+ (E), full-length nNOS (F), and full-length nNOS + CaM (G). H, the data of G resolution enhanced in post-acquisition processing. The numbers under each line in the data indicate inter-flavin distances in Å. The vertical dashed lines and dotted lines show the similarities between the data of B and F, and C and H, respectively. Experimental conditions are given under “Materials and Methods.” The schematics show the observed distance distribution between the FAD (blue) and FMN (cyan) semiquinones in each sample.

