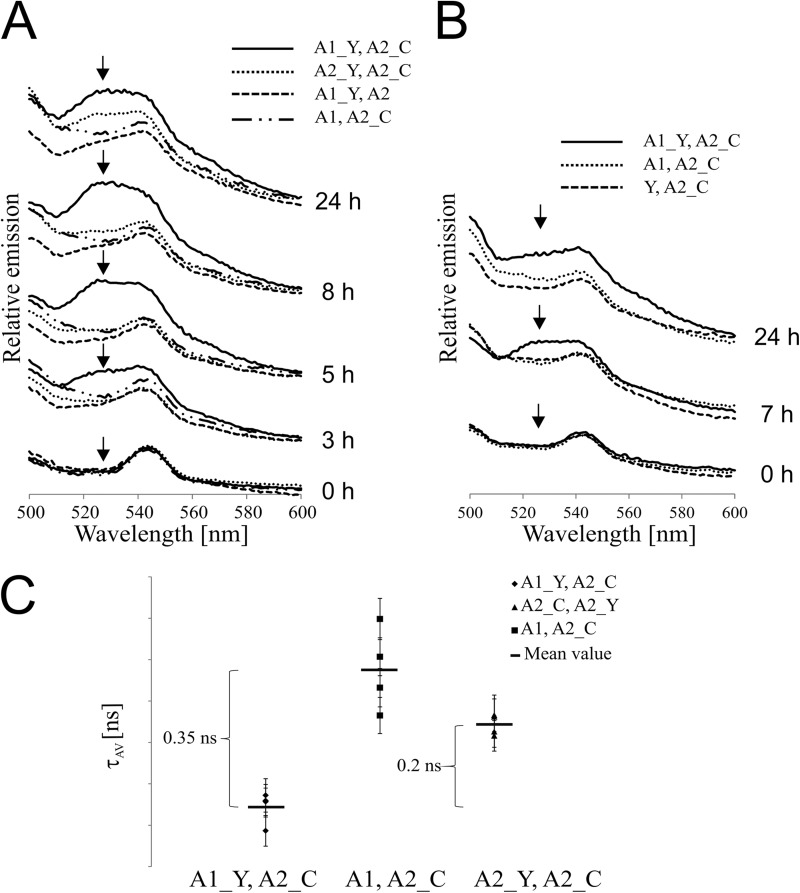
FIGURE 3.
Formation of NblA16803–NblA26803 heterodimers in vivo. The nblA1/nblA2 double mutant of Synechocystis 6803 was complemented in trans, under the control of the nblA promoter and terminator, with one NblA protein C-terminally fused to the FRET donor Cerulean (C) and the other fused to the FRET acceptor YFP (Y). For expression of NblA fusion proteins, the Synechocystis 6803 mutants were starved of combined nitrogen. A, fluorescence emission spectra of Synechocystis 6803 cells. Emission spectra of A1_Y, A2_C, A1_Y, A2, A1, A2_C, and A2_Y, A2_C mutants were recorded on cultures adjusted to an A750 of 0.3. Cerulean was excited at 458 nm, and emission of the FRET partner YFP was recorded between 500 and 600 nm after 0, 3, 5, 8, and 24 h of nitrogen depletion. B, fluorescence emission spectra of Synechocystis 6803 cells. Emission spectra of A1_Y and A2_C, A1 and A2_C, and Y and A2_C mutants were recorded at cell densities corresponding to an A750 of 0.3. Cerulean expressed in the cells was excited at 458 nm, and emission of the FRET partner YFP was recorded between 500 and 600 nm after 0, 7, and 24 h of nitrogen depletion. C, fluorescence lifetime spectroscopy of the A1_Y and A2_Cer, A2_C and A2_Y, and A1 and A2_C mutants. Cells at a density corresponding to an A750 of 0.3 were analyzed after 8 h of nitrogen starvation. Fluorescence intensity measurements were carried out in 1-cm cuvettes with excitation at 440 nm and emission of cerulean-based fluorescence decay recorded at 475 nm. Only a single photon every 100 laser pulses was registered (1 count); therefore, measurements were repeated for a total of 10,000 counts, and the measured time differences were sorted into a histogram. Each measurement was repeated seven times. The resulting decay curves were analyzed by fitting to the sum of two exponential terms using a non-linear least squares iterative procedure (FluoFit, PicoQuant). For each measurement, the amplitude-weighted lifetime (τAV) of cerulean was calculated. The mean values of τAV for each biological replicate are shown in the diagram, and the S.D. for each value is indicated. Furthermore the mean value of τAV for cerulean-based fluorescence of each mutant is shown.

