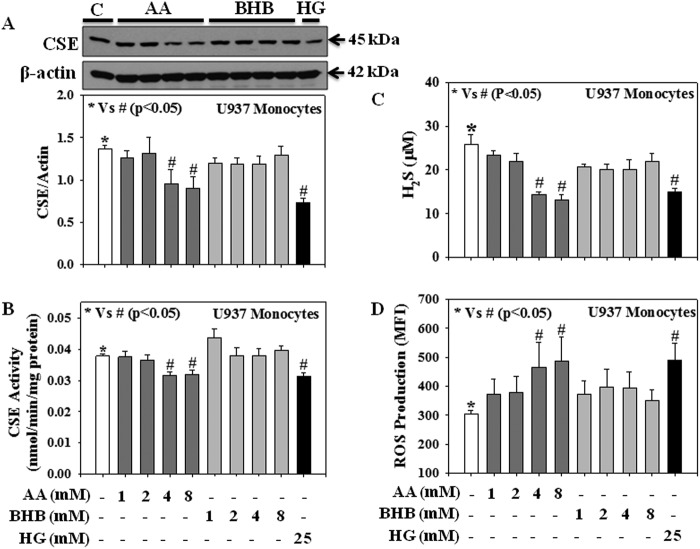
FIGURE 4.
Effect of AA, BHB, and HG on both CSE protein expression and its activity, H2S levels, and the intracellular ROS production in U937 monocytic cells. A, CSE expression. B, CSE activity; C, H2S levels; D, ROS production. Cells were treated with AA (1, 2, 4, or 8 mm) or BHB (1, 2, 4, or 8 mm) or HG (25 mm) for 20 h. Values are expressed as the mean ± S.E. (n = 3).

