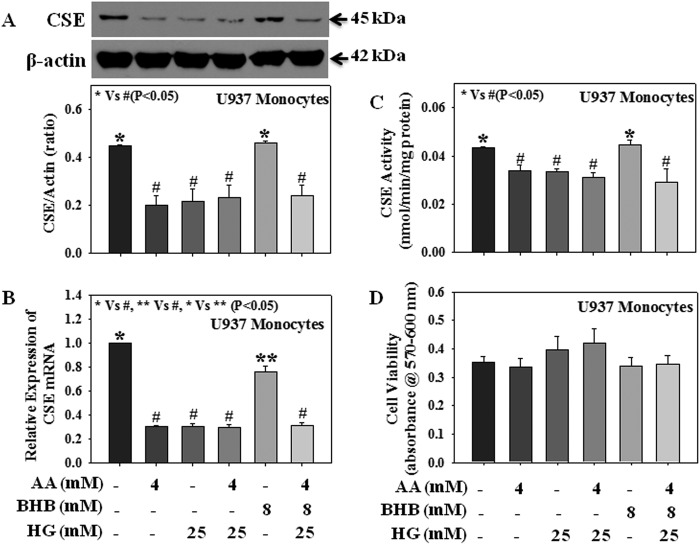
FIGURE 6.
Effect of AA, BHB, and HG either alone or in combination on the mRNA expression, protein expression, and enzyme activity of CSE in U937 monocytic cells. A, CSE protein expression. B, CSE mRNA expression; C, CSE activity. D, cell viability. Cells were treated with AA (4 mm), BHB (8 mm), or HG (25 mm) either alone or in combination for 20 h. Values are expressed as the mean ± S.E. (n = 3).

