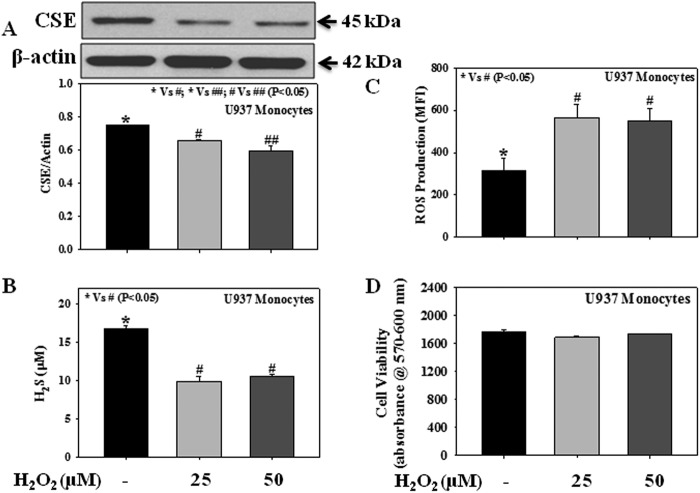
FIGURE 8.
Effect of the exogenous oxidant H2O2 on the protein expression of CSE, levels of H2S, and the intracellular ROS production in U937 monocytic cells. A, CSE expression. B, H2S levels. C, ROS production. D, cell viability. Cells were treated with H2O2 (25 or 50 μm) for 3 h. Values are expressed as the mean ± S.E. (n = 3).

