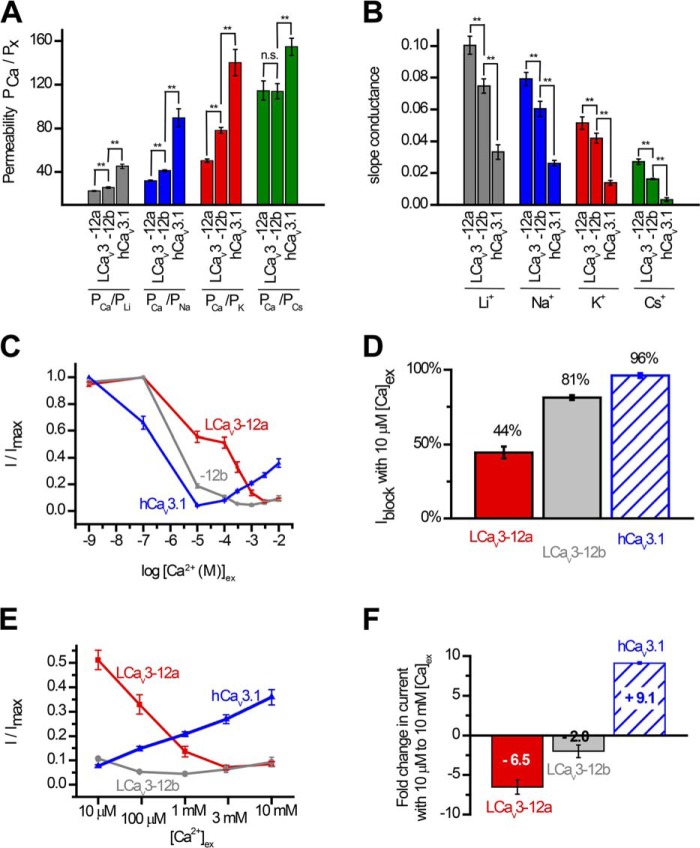
FIGURE 5.
Snail LCav3 channels with exon 12a are highly permeable to sodium ion and weakly permeant to calcium ions, compared with LCav3 channels with exon 12b or human Cav3. 1 channels. A, relative permeabilities of calcium to monovalent cations (PCa/Px) generated using reversal potentials (shown in Fig. 3B) inputted into a bi-ionic Nernst equation (see under “Experimental Procedures”). B, slope conductance of outward currents (shown in Fig. 3B) measured as the linear fit of currents generated from steps between +70 and +80 mV. C, increasing block of maximal ionic current (I/Imax) in 60 mm Na+ external with increasing [Ca2+]ex from 10−9 to 10−5 m reflects the competition between sodium and calcium ions to permeate the pore. D, bar graph illustrates the weak block of LCav3-12a channel current (44%) compared with LCav3-12b (81%) and human Cav3.1 (96%) channels at 10 μm [Ca2+]ex. E, X-scale shown for calcium dose-response curves (C) limited to rise in [Ca2+]ex from 10 μm to 10 mm with corresponding bar graph (F), reflecting the dramatic fold decrease (×6.5 and ×2.0) in calcium permeability with snail LCav3-12a and -12b channels, respectively, compared with the dramatic fold increase (×9.1) in calcium current through the physiological range for external calcium ions. Statistical comparisons in A and B were done using a one-way analysis of variance combined with a Student-Newman-Keuls post hoc test with the following: *, p < 0.05; **, p < 0.01, and ***, p < 0.001; n.s., not significant. Statistics for Fig. 5 are shown in Table 5.

