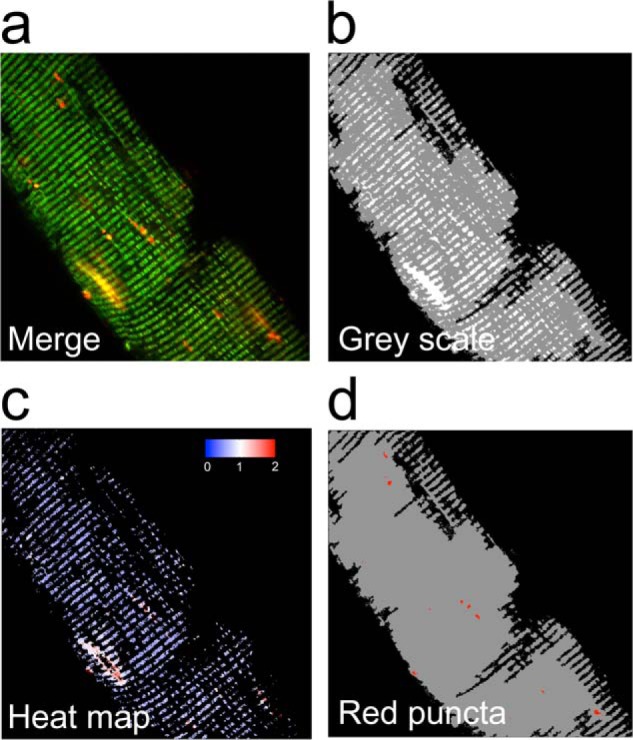
FIGURE 2.

Computational analysis of MitoTimer fluorescence. A Matlab-based computer algorithm was designed for identification of MitoTimer positive pixels, quantification of MitoTimer fluorescence spectrum shift between green and red, and accumulation of pure red puncta. a, a representative confocal image (merged image of green and red) of a mouse FDB muscle fiber; b, the processed confocal image showing background (black), fiber (gray), and MitoTimer (white) pixels; c, corresponding heat map of the red:green ratio of MitoTimer positive pixels; and d, pure red puncta identified by the MitoTimer image analysis algorithm.
