
Figure 5.
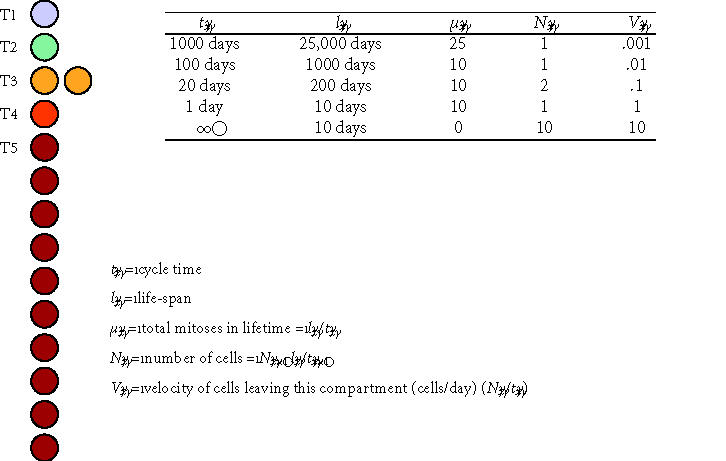
Conceptual model of transit cell amplification. This schematic diagram and associated table illustrate several central concepts in the proliferating transit cell paradigm. A stem cell (T1) and three proliferating transit cell populations (T2, T3, and T4) are modeled at steady state in a contiguous linear array supporting a population of mature cells (M/T5). All cell division is modeled as asymmetric events associated with renewal of the founding cell. The table illustrates hypothetical values for the cycle time (tx), life-span for cells in each compartment (lx), the effective mean number of cell divisions in each compartment (μx), the resulting number of cells resident in each transit compartment (Nx), and a velocity or rate at which cells leave each compartment (Vx). In this model, the originating stem cell survives throughout the life of the individual (l1 = 25,000 days ∼ 68 years), cycling as a slow rate of one cell division every 1000 days (t1 = 1000 days). During the life of the stem cell, it divides a total of 25 times (μ1 = 25). The velocity of cells leaving the stem cell compartment and entering the T2 compartment is 1 cell per 1000 days, or V1 = 0.001 cells/day. Cells in the T2 compartment function similarly to feed the T3 compartment, and so on. Cells in downstream populations (T2, T3, and T4) divide more rapidly than cells in upstream compartments. In contrast to the originating stem cells, the cells in downstream compartments also have limited self-renewal capacity, resulting in decreasing functional life-span for cells in each compartment. Note that, in the absence of any transit populations, the upstream stem cell would need to divide 25,000 times to generate the same number of mature cells over the life of the individual.