
Figure 6.
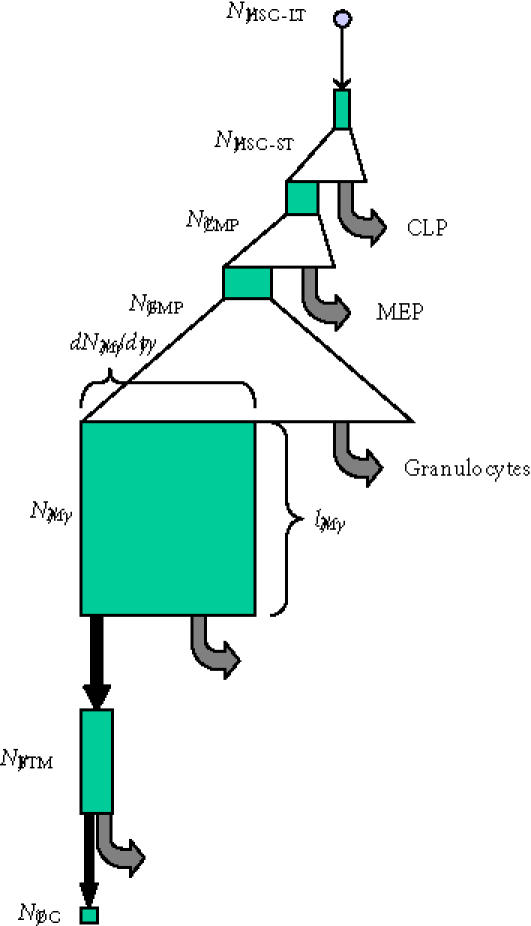
Transit cell populations in osteoclast formation. The conceptual hierarchy of transit cell populations upstream of the osteoclast is illustrated. Triangles indicate phases of clonal expansion arising from proliferating transit populations. Black arrows indicate transit events in which cells move from one compartment to another associated with changes in their intrinsic biological properties. Grey arrows indicate departure of cells from the upstream compartment to other cell compartments. Green boxes illustrate the conceptual size of each cell population, where the width of the box represents the rate at which cells are added to or leave each compartment at steady state, and the height of each box represents the mean life-span or residence time of cells within each compartment. (Abbreviations: HSC-LT, long-term repopulating hematopoietic stem cell; HSC-ST, short-term repopulating hematopoietic stem cell; CMP, common myeloid progenitor; CLP, common lymphoid progenitor; MEP, megakaryocyte erythroid progenitor; GMP, myelomonocytic progenitor; M, monocyte; BMT, bone tissue monocyte; OC, osteoclast nuclei [114].)