
Figure 9.
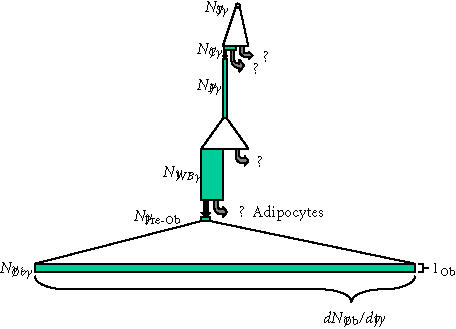
Transit cell populations upstream of osteoblasts. The putative transit cell populations that are upstream of the osteoblast are shown, using the same illustration strategy described in Figures 6 and 7. The upstream originating stem cell, the pericyte, and the pre-osteoblast (type I osteoblast) are all presumed to be proliferating transit populations. Precise features of this diagram (the magnitude of expansion, the life-span, the rate of transit, and even pathways of transit between these potential populations) must be considered highly speculative, though it is consistent with available data and prevailing theory. Regardless of this speculation, it is useful to compare this diagram to that illustrating the events that occur downstream of the osteoblast shown in Figure 7. This comparison illustrates the very small rate of cell division and small rate of transit that must be expected in transit populations upstream of the osteoblast, relative to downstream events. Similarly, it also illustrates that one or more of these upstream populations (eg, the Westin-Bainton cell) might be present in comparable numbers to the active osteoblast population, if the life-span of cells in these transit compartments significantly greater that was the life-span of the secretory osteoblast. (Abbreviations: S, upstream stem cell; C, circulating stem cell; P, vascular pericytes; WB, Westen-Bainton Cells; Pre-Ob, Pre-osteoblast (Type I osteoblast); Ob, mature secretory osteoblast.)