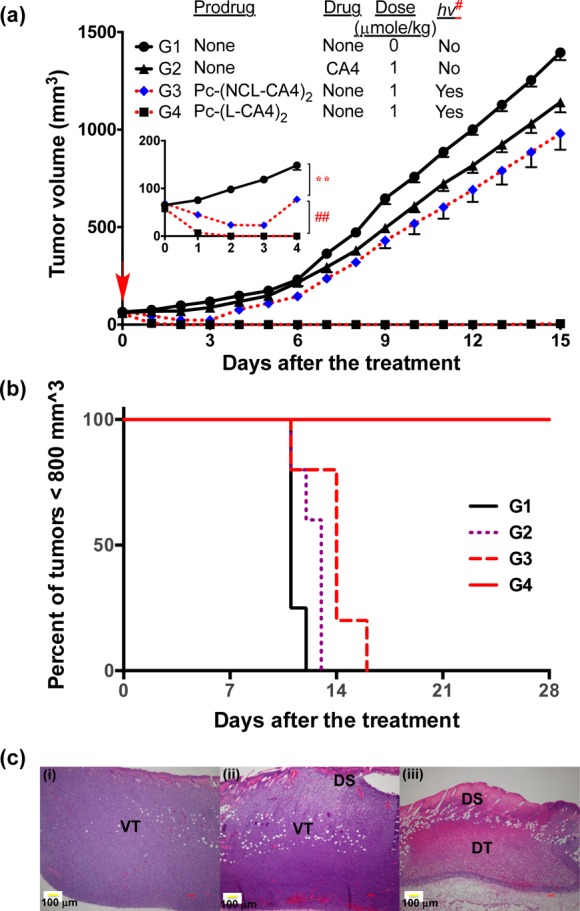
Figure 7.

Antitumor effects. (a) Tumor growth curves, drug IV administration: once a day on day −1, illumination 24 h postdrug administration [hv#: 100 mW/cm2 for 30 min (180 J/cm2) or 200 mW/cm2 for 30 min (360 J/cm2)], 5 mice per group except the control group (4 mice). Error bars represent SE. In inset: the order of tumor size was G1 > G3 > G4 during day 1 to day 4 [** p < 0.01 (G1 vs G3, from day 1 to day 4) and ## p < 0.01 (G3 vs G4, from day 1 to day 4)]. (b) Kaplan–Meier plot of response to treatment. (c) H&E staining of tumors 24 h post-illumination from (i) control mice or mice treated with (ii) Pc-(NCL-CA4)2, or (iii) Pc-(L-CA4)2. Prodrug administration and illumination conditions were same as for those in (a). VT, viable tumor; DT, damaged tumor; and DS, damaged skin.
