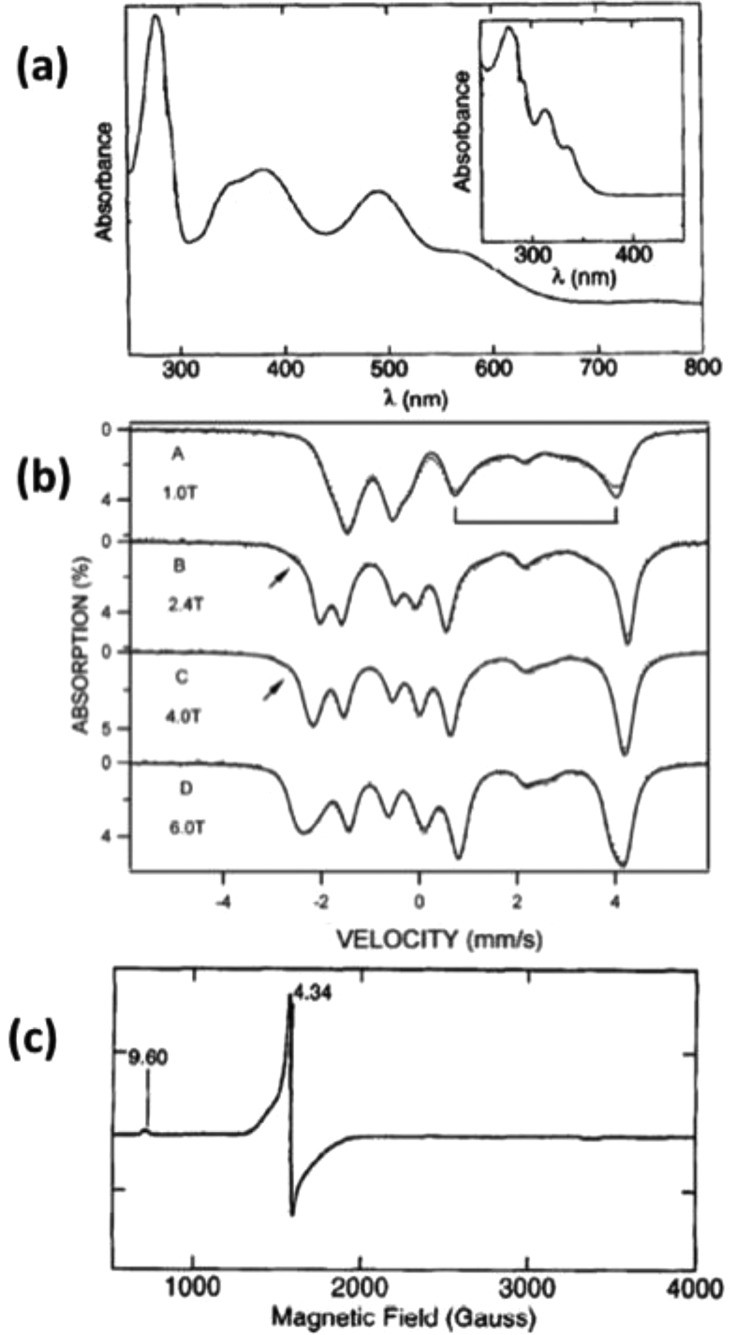
Figure 16.
Representative spectra of rubredoxins. (a) UV–vis spectra of ferric and ascorbate reduced ferrous (inset) CpRd. (b) Mössbauer spectra of dithionite reduced ferrous CpRd measured at 4.2 K under a magnetic field applied parallel to the γ-rays. Reprinted from ref (623). Copyright 2002 American Chemical Society. (c) EPR spectra of CpRd. Reprinted with permission from ref (611). Copyright 1996 Elsevier.

