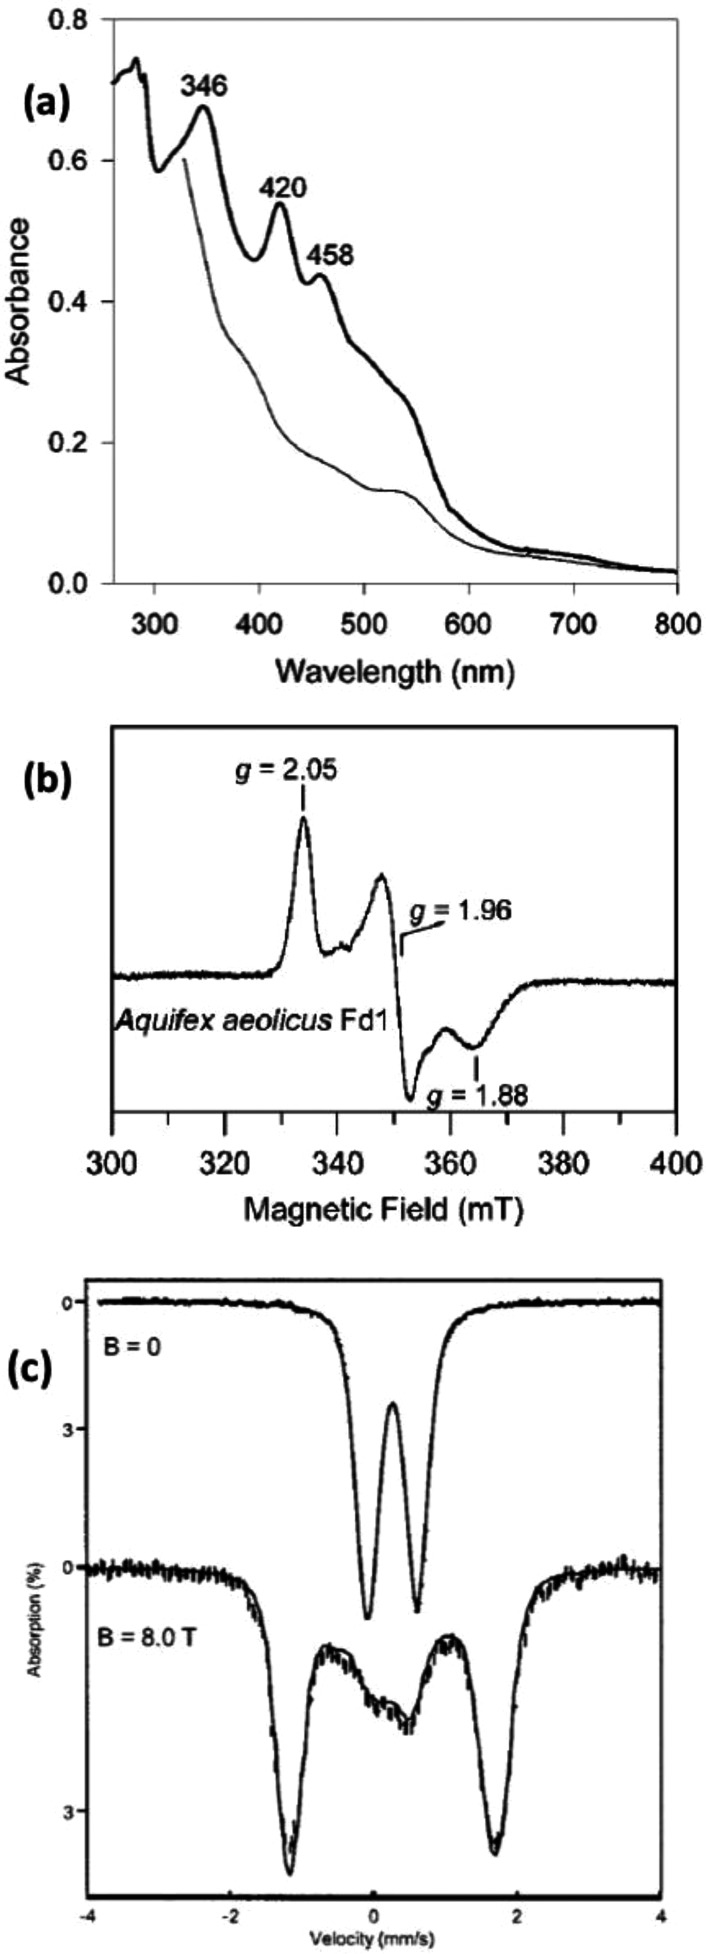
Figure 23.
Representative spectra of [2Fe–2S] ferredoxins:728 (a) UV–vis spectra of reduced (thin line) and oxidized (thick line) forms of ferredoxin from Aquifex aeolicus; (b) X-band EPR of [2Fe–2S]+ ferredoxin from Aq. aeolicus at 20 K; (c) Mössbauer of the [2Fe–2S]2+ state of ferredoxin from Aq. aeolicus at 4.2 K in zero field (upper) and an 8.0 T applied field parallel to the observed γ radiation (lower). Reprinted from ref (728). Copyright 2002 American Chemical Society.

