
Figure 6.
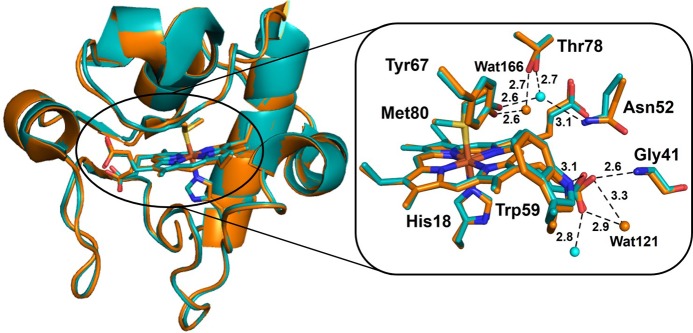
Overall structural overlay of the reduced (cyan, PDB ID 1YCC) and oxidized (orange, PDB ID 2YCC) iso-1-cyt c (left). A close look at the heme site and the nearby residues is shown on the right along with some hydrogen bond interactions.
Official websites use .gov
A
.gov website belongs to an official
government organization in the United States.
Secure .gov websites use HTTPS
A lock (
) or https:// means you've safely
connected to the .gov website. Share sensitive
information only on official, secure websites.
Overall structural overlay of the reduced (cyan, PDB ID 1YCC) and oxidized (orange, PDB ID 2YCC) iso-1-cyt c (left). A close look at the heme site and the nearby residues is shown on the right along with some hydrogen bond interactions.