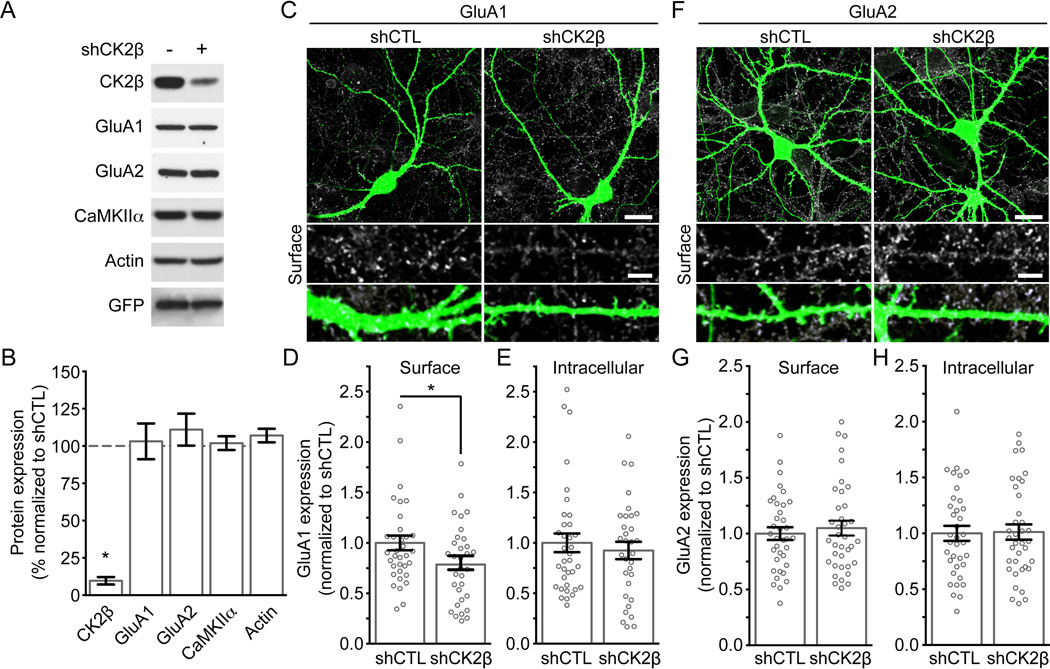
Figure 3. A reduction of CK2 expression in cultured hippocampal neurons decreases surface expression of GluA1, but not GluA2.
A) Lysates from cultured neurons transduced with shCTL or shCK2β lentiviruses were prepared and immunoblotted with specific antibodies as indicated. B) Bar graph of protein expression in (A) presented as mean ± SEM and * P < 0.0001 using unpaired t-test. Data obtained from at least 4 experiments. C–H) Hippocampal neurons transfected with shCTL or shCK2β were stained live for endogenous surface GluA1 (C–D) or GluA2 (F–G) under non-permeabilized conditions before being examined by confocal microscopy. Representative images show AMPAR surface expression and EGFP from a transfected neuron. Scale bar represents 20 µm. At higher magnification, the scale bar represents 5 µm. C–H) Quantitation of AMPAR expression. Bar graph is presented as mean ± SEM. The scatter plots represent the distribution of each cells analyzed and show that shCK2β, but not shCTL, reduces surface expression of GluA1 (C) but not GluA2 (E) without affecting total expression of GluA1 (E) or GluA2 (H). Images not shown for (E) and (H) Each group contain 32–37 cells from 4 independent experiments (* P < 0.05 using unpaired t-test).

