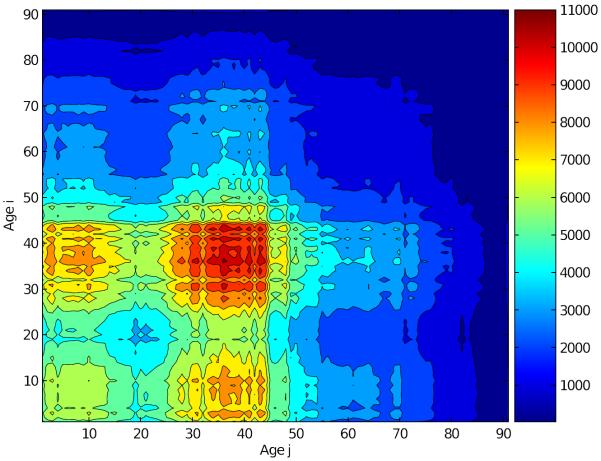
Figure 2.
The total number of proportional contacts between age group i and j. The contact rates are defined by the elements of the n × n matrix, Cij, where Cij represents the total number of proportional contacts of all people of age i with people of age j per day. Note that the contacts between age group i and j is the same as between age group j and i, resulting in a symmetric graph.

