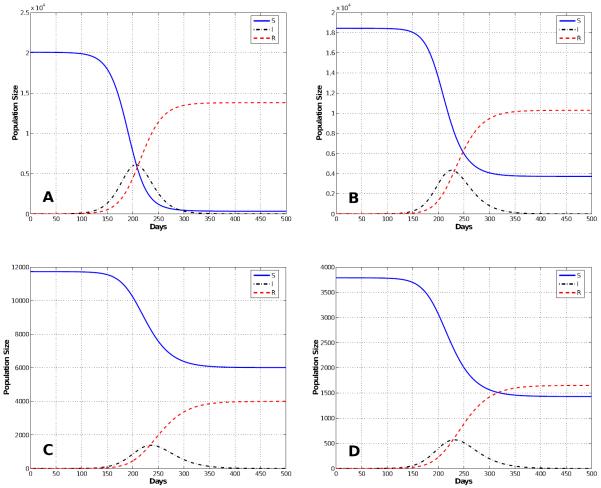
Figure 8.
Solutions of the multi-group SIR model with stage progression for a normal contact matrix for age groups 20 (A), 50 (B), 65 (C), and 85 (D). Notice the impact that partial immunity has on the final epidemic size on age groups < 41 years of age. The epidemic takes o faster in this age group and nearly all of the people are eventually infected. Because in a real epidemic there would certainly be significant behavior changes, this prediction illustrates why the behavior changes must be included before any model predictions are used to guide policy.

