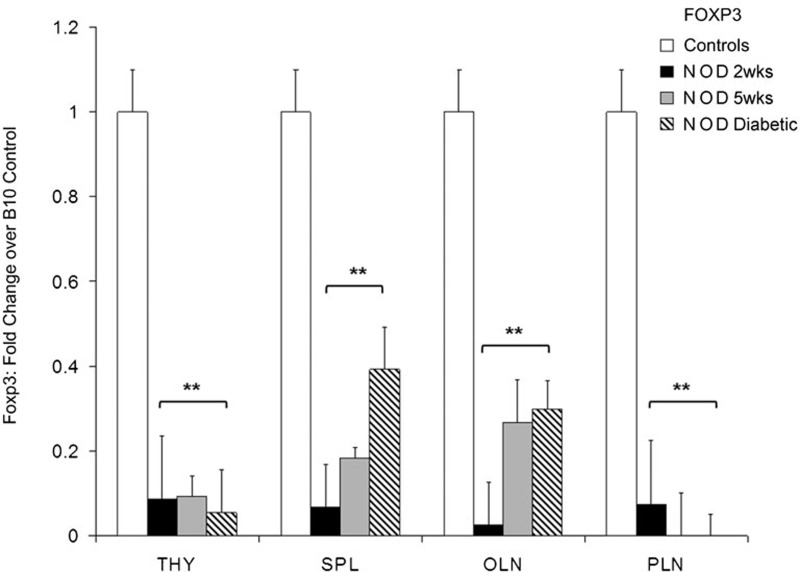
Figure 3.
Distribution of Foxp3 transcripts among secondary lymphatic tissues of NOD mice at different ages and after onset of hyperglycemia. Transcript quantities were determined by specific primer-probe pairs in real-time qRT-PCR analysis in the THY, SPL, PLNs and OLNs. Fold change over autoimmunity-free control mice (n=4) was determined for different age groups of mice: (i) 2 weeks, n=6; (ii) 5 weeks, n=5; and (iii) diabetic, n=9. For relative gene expression of autoimmunity-free control groups: (i) 2 weeks, n=3; (ii) 5 weeks, n=5; and (iii) 12–25 weeks, n=4. Statistical significance was determined by the unpaired parametric t-test. *P<0.05; **P<0.01, relative to baseline autoimmunity-free control. NOD, non-obese diabetic; OLN, other pancreatic lymph node; PLN, pancreatic lymph node; qRT-PCR, Real-Time quantitative reverse transcriptase polymerase chain reaction; SPL, spleen; THY, thymus; Treg, T regulatory.

