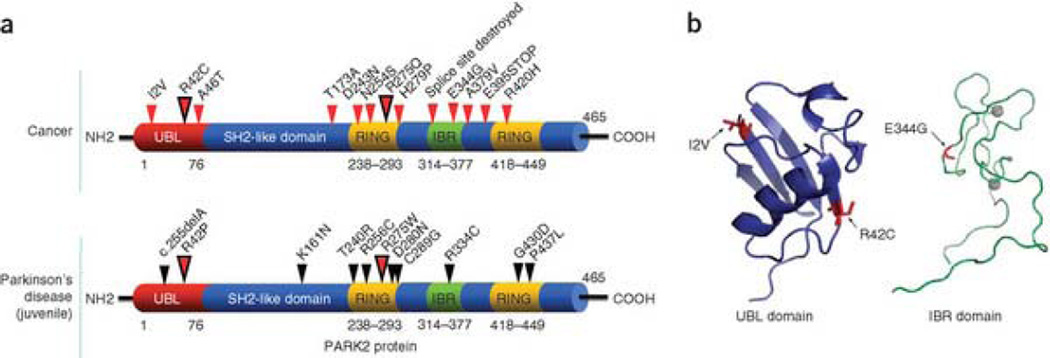
Figure 2. Somatic mutations of PARK2 in human cancers.
(a) Summary of PARK2 mutations found in cancer (top) and early-onset Parkinson's disease (bottom). Small arrows show the location of mutations and corresponding amino acid changes. Larger dual-color arrows indicate amino acids that are affected in both cancer and PD; resultant amino acids are different. Mutations cluster in similar regions in both cancer and PD. (b) Structural analysis of cancer-specific mutations in the UBL (left) and IBR (right) domains. Ribbon diagram is shown (with alpha helices and beta sheets). Mutations are shown in red and labeled. Gray circles represent zinc atoms.

