
Figure 2.
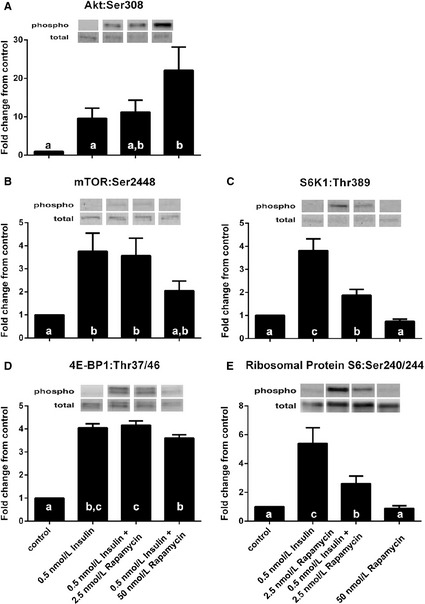
The effect of rapamycin on 0.5 nmol/L insulin‐stimulated increases in Akt and mTORC1 signaling. Cells receiving rapamycin were pretreated with either 2.5 or 50 nmol/L rapamycin (in HBS) for 30 min prior to receiving insulin. Then insulin (0.5 nmol/L) in HBS was incubated with cells with or without 2.5 or 50 nmol/L rapamycin for 30 min. Myotubes were lysed and protein extracts were analyzed using western blotting. abcColumns with uncommon letters differ, main effect of treatment, (A) P = 0.0246 for AktSer308; (B) P = 0.0240 for mTORS er2448; (C) P = 0.0004 for S6K1Thr389; (D) P < 0.0001 for 4E‐BP1Thr37/46; (E) P = 0.0019 for ribosomal protein S6Ser240/244. Resulting images are displayed from a representative experiment above each graph. For arrangement of samples in gels for electrophoresis, samples from two experiments were run on a single gel. Thus, all samples were not run on a single gel/blot. Data are mean ± SEM and are presented as phospho/total made relative to baseline.