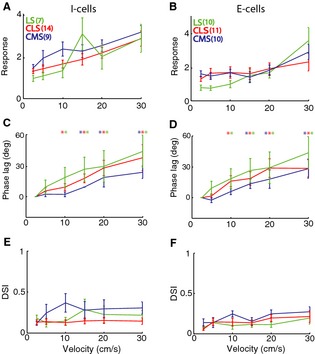
Figure 3.

ELL pyramidal cells across CMS, CLS, and LS display similar velocity tuning curves. (A) Population‐averaged velocity tuning curves for I cells from LS (green), CLS (red), and CMS (blue). Note that the curves did not differ significantly from one another (P > 0.05, one‐way ANOVA) at all velocities. (B) Population‐averaged velocity tuning curves for E cells from LS (green), CLS (red), and CMS (blue). Note that the curves did not differ significantly from one another (P > 0.05, one‐way ANOVA) at all velocities except at 2.5 cm/sec in which CMS cells displayed stronger response compared to LS cells (P = 0.03, one‐way ANOVA). Error bars show 1 SEM. (C) Population‐averaged phase lag difference (relative to 2.5 cm/sec) as a function of velocity for I cells across segments. Note that the curves did not differ significantly from one another (P > 0.05, one‐way ANOVA) at all velocities. (D) Population‐averaged phase lag difference (relative to 2.5 cm/sec) as a function of velocity for E cells across segments. Note that the curves did not differ significantly from one another (P > 0.05, one‐way ANOVA) at all velocities. For C,D, we observed larger phase lags for larger velocities as the phase lag difference were significantly different from zero (“*”) as the P = 0.05 level using a sign rank test. (E) Population‐averaged directional selectivity index (DSI) values as a function of velocity for I cells across segments. Note that the curves did not differ significantly from one another (P > 0.05, one‐way ANOVA) at all velocities. (F) Population‐averaged DSI values as a function of velocity for E cells across segments. Note that the curves did not differ significantly from one another (P > 0.05, one‐way ANOVA) at all velocities. For E,F, all values of DSI were not significantly different from zero (P > 0.05, see methods).
