
Figure 6.
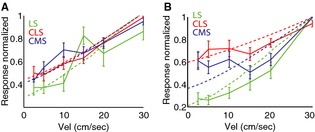
A simple model of ELL pyramidal cell receptive field organization can reproduce experimental data. (A) Population‐averaged normalized velocity tuning curves for LS (solid green), CLS (solid red), and CMS (solid blue) I cells with corresponding model fits (dashed lines). (B) Population‐averaged normalized velocity tuning curves for LS (solid green), CLS (solid red), and CMS (solid blue) E cells with corresponding model fits (dashed lines). Error bars show 1 SEM.