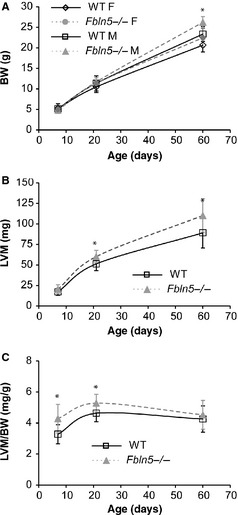
Figure 2.

Body weight (BW) (A) increases with age, is affected by sex, and is higher in Fbln5−/− mice at P60. Left ventricle mass (LVM) (B) is increased in Fbln5−/− mice at P21 and P60. Normalized LVM mass (LVM/BW) (C), an indication of left ventricular (LV) hypertrophy, is increased in Fbln5−/− mice at P7 and P21. *P < 0.05 between genotypes. n = 5–15 per group (A). n = 14–23 per group (B, C).
