
Figure 6.
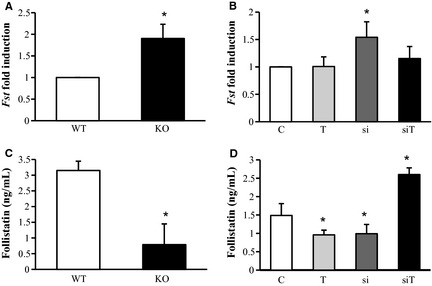
Effect of Mstn knockdown and training on follistatin mRNA expression of gastrocnemius muscle and serum protein level. (A) Quantitative RT‐PCR analysis of follistatin mRNA levels in Mstn −/− muscle. n = 5 per group, *P < 0.05 significantly different from WT. (B) Quantitative RT‐PCR analysis of follistatin mRNA levels following siRNA‐mediated Mstn knockdown ± exercise. n = 7 per group, *P < 0.05 significantly different from control group. (C) Immuno‐PCR analysis to determine serum concentration of follistatin from Mstn −/− mice. n = 5 per group, *P < 0.05 significantly different from WT. (D) Immuno‐PCR analysis to determine serum concentration of follistatin following siRNA‐mediated Mstn knockdown ± exercise. n = 7 per group, *P < 0.05 significantly different from control group. C = control group, T = training group, si = treatment with siRNA, siT = training + siRNA. KO = Mstn −/− mice, WT = wild‐type mice. Values are presented as means ± SD.