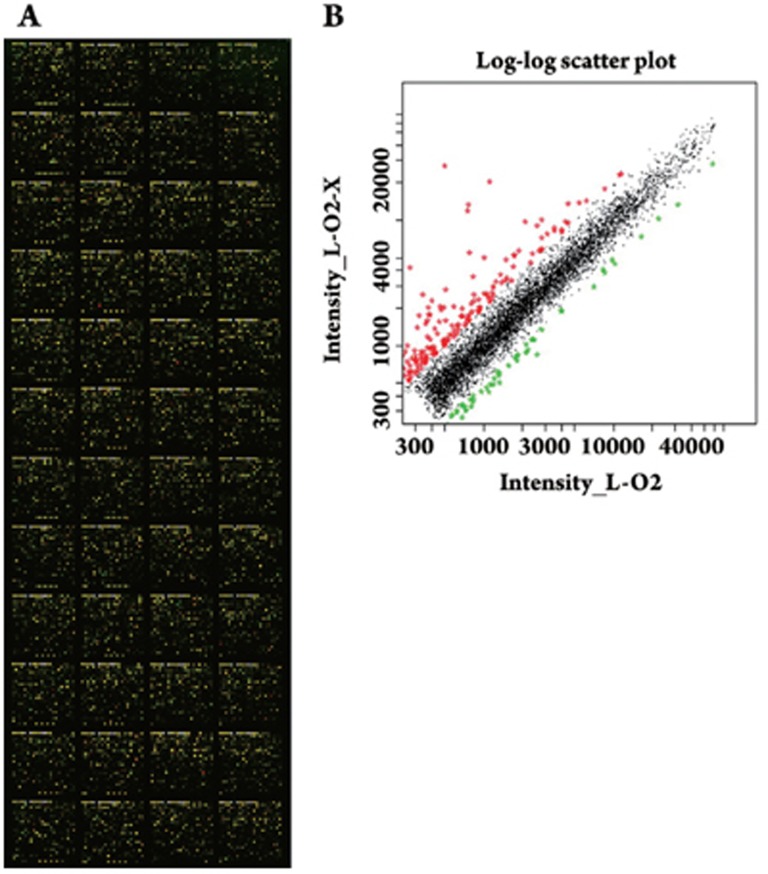
Figure 1.
Examination of the L-O2-X gene expression profiles by cDNA microarray analysis. (A) A scanning image of the hybridizing signals on gene chips showed high expression (red), low expression (green), and no expression changes (yellow) between L-O2 and L-O2-X cells. (B) Scatter plot graph of Cy3-labeled and Cy5-labeled probes hybridizing with the microarray. Each point on the plot represented a gene hybridization signal. The black points represented ratios that ranged from 0.5 to 2.0 and belonged to the no difference group. The red points represented the ratios that were >2.0 and the green points represented the ratios that were <0.5, both of which indicate that gene expression was most probably altered.

