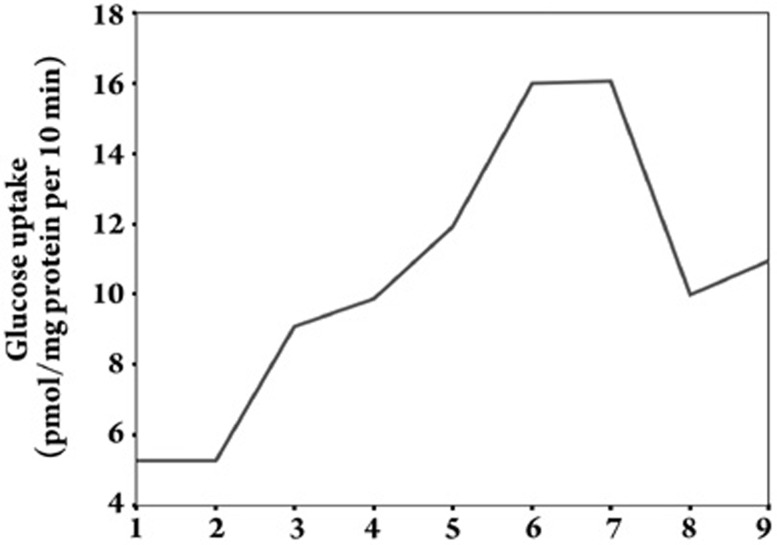
Figure 2.
Glucose uptake of hypoxic cardiomyocytes treated with different Gs-Rb1 concentrations in vitro. The numbers 1, 2, 3, 4, 5, 6, and 7 on the X-axis refer to the concentration of Gs-Rb1 incubation for 12 h (ie, 0, 10, 50, 100, 200, 400, and 500 μmol/L). Number 8 is 500 μmol/L ara A based on 200 μmol/L Gs-Rb1 and 500 μmol/L CoCl2, and number 9 is 0.5 μmol/L wortmannin based on 200 μmol/L Gs-Rb1 and 500 μmol/L CoCl2. The mean±SD of glucose uptake (pmol/mg protein per 10 min incubation) of cardiomyocytes was 5.263±0.064, 5.277±0.107, 9.070±0.131, 9.890±0.197, 11.900±0.200, 15.933±0.153, 16.033±0.306, 9.971±0.419 and 10.829±0.607, respectively. n=3 for all groups.

